Globalization, environmental decay and sexism in the capitalist world system
1) Introduction
The conservative-liberal paradigm, that shaped politics and economics after the fall of Communism in Europe, seems to have reached its limits, while the predictions of world society paradigms - starting with Karl Polanyi - gain in relevance. Is capitalism, at the very moment, when it seemed to triumph over the communist rival, unable to integrate the new territories of the East (Chase-Dunn and Hall, 1997), thus producing anew the tensions between the centers and the semi-peripheries that, in the end, historically were so instrumental in the rise of historical communism? Or is the ‘real existing capitalist order’, by the very socio-political set-ups and alliances it produces, at least not able to overcome phenomena of monopoly, distribution coalitions, and institutional age, that lead to impoverishment and dependence in wide parts of our globe? And is capitalism, although in theory open to reform, de-facto unable to do so at the expense of its own long-term survival capability?
Sunkel first proposed in his ’Transnational capitalism and national disintegration (in Latin America)’ the still provocative thought that transnational investment and integration might go hand in hand, under certain conditions, with an increasing relative social polarization between rich and poor in the host countries of the evolving transnational system and on the international level. At that time, Sunkel said:
‘The interpretation so far advanced suggests that the international capitalist system contains an internationalized nucleus of activities, regions and social groups of varying degrees of importance in each country. These sectors share a common culture and ‘way of life’, which expresses itself through the same books, texts, films, television programs, similar fashions, similar groups of organization of family and social life, similar style of decoration of homes, similar orientations to housing, building, furniture and urban design. Despite linguistic barriers, these sectors have a far greater capacity for communication among themselves than is possible between integrated and marginal persons of the same country who speak the same language (...) Modernization implies the gradual replacement of the traditional productive structure by another of much higher capital intensiveness (...) On the one hand, the process of modernization incorporates into the new structures the individuals and groups that are apt to fit into the kind of rationality that prevails there; on the other hand, it expels the individuals and groups that have no place in the new productive structure or who lack the capacity to become adapted to it. It is important to emphasize that this process does not only prevent or limit the formation of a national entrepreneurial class, as indicated by Furtado, but also of a national middle class (...) and even a national working class. The advancement of modernization introduces, so to speak, a wedge along the area dividing the integrated from the segregated segments (...) In this process, some national entrepreneurs are incorporated as executives into the new enterprises or those absorbed by the TRANCO (i.e. transnational corporations), and others are marginalized; some professionals, forming part of the technical staff and the segment of employees are incorporated, and the rest are marginalized; part of the qualified labor supply and those that are considered fit to be upgraded are incorporated, while the remainder are marginalized.
The effects of the disintegration of each social class has important consequences for social mobility. The marginalized entrepreneur will probably add to the ranks of small or artesanal manufacture, or will abandon independent activity and become a middle class employee. The marginalized sectors of the middle class will probably form a group of frustrated lower middle class people trying to maintain middle class appearance without much possibility of upward mobility and terrorized by the danger of proletarization. The marginalized workers will surely add to the ranks of absolute marginality, where, as in the lower middle class, growing pools of resentment and frustration of considerable demographic dimension will accumulate (...) Finally, it is very probable that an international mobility will correspond to the internal mobility, particularly between the internationalized sectors (...) The process of social disintegration which has been outlined here probably also affects the social institutions which provide the bases of the different social groups and through which they express themselves. Similar tendencies to the ones described for the global society are, therefore, probably also to be found within the state, church, armed forces, political parties with a relatively wide popular base, the universities etc.’ (Sunkel, 1972: 18-42).
Globalization since 1980 negatively affected the lives of around 1.5 thousand million people on earth, whose per-capita incomes were lower than in earlier decades. These 1.5 thousand million people live in around 100 countries; while 15 nations experienced rapid capitalist development over the last decade. Among the world’s desperate nations, 43 countries had a per-capita income which was lower - in real terms - than that of the 1970s (UNDP, 1996, 1997)
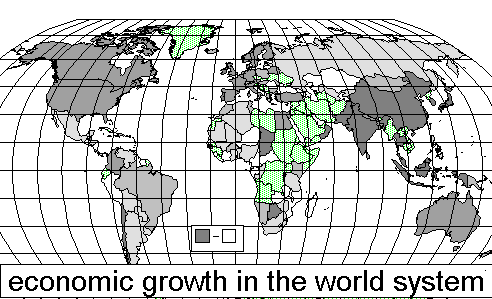
More than ever before, economic growth tended to be concentrated in some regions of the world system, most notably East and Southeast Asia and the Pacific, while other regions tended to be excluded. Map 1.1 shows the tendencies of economic growth in the world system since 1980:
Map 1.1: economic growth in the world system since 1980

Source: EXCEL 7.0 graph from UNDP (1996) data
Not only the world’s South, but also the extreme North seems to be put at increasing risks. And now, after the Asian crash, even those 15 ‘emerging markets’ are put at risk, with only the USA remaining as the last ‘capitalist miracle’. Among the nations, that reached their present-day real per capita income level already back in the 1980s, we find - perhaps to our surprise - the northern democracies Canada, Finland, and Iceland, among a total of 31 nations. In all, these three OECD democracies, 7 ‘other Asian’ nations, 14 Arab countries, 20 Eastern European and CIS countries, 22 Latin American countries and 35 countries of Sub-Saharan Africa were, in per capita terms - richer in earlier decades. China, India, 20 OECD democracies, 2 Arab countries, 12 Latin American and Caribbean countries and 8 Sub-Saharan African nations, together with 21 ‘other Asian countries’, increased their per-capita income over the last decades (UNDP, 1996). In the developing countries, despite the increases in life expectancy over 1960-93, the specter of poverty is still overwhelming. 1.3 billion people are to be classified as poor, 800 million people do not eat enough food, and 500 million are chronically malnourished. Each year, 20 million hectares of tropical forests are degraded or completely cleared; there are now 11 million refugees in the developing countries, and entire regions are affected by destabilization and war, most notably the lake region of East-Central-Africa, wide areas of Central Asia, and some countries of West Africa.
The relative polarization effects along the welfare borders of the world, which happen to be the outward borders of the economic integration zones, drawn up by the rich countries, are the first basic conflict that confronts the process of transnational integration, and especially European integration today. The second basic conflict is the tendency towards increasing social exclusion in the trasnationally integrated core areas and in the semi-peripheries and peripheries themselves. Suffice to look at contemporary Mexico after NAFTA to find preliminary evidence that speaks in favor of Sunkel and against the optimistic predictions of the integrationists. In the words of contemporary journalists:
Le Monde Diplomatique for April 97 reported the latest research into
the incredible pace of the concentration of Capital. This is leading
to what Le Monde calls a "A Global Government of the Multinationals".
It reports that, Eastern Europe and the Former Soviet Union have been
"colonised" in the name of "the glories of the free market" and
that, inspite of 41 million unemployed in the advanced capitalist
countries, "the manufacturing industries worldwide (excepting those of
China) only operate at 70-75% of their capacity". "The top 200
companies are conglomerates whose planetary activity cover all sectors
without distinction, the primary, secondary and tertiary, the grand
agricultural exploiters, the manufacturers, financial services,
commerce, etc. Geographically they are divided between ten countries:
Japan (62), the United States (53), Germany (23), France (19), Britain
(11), Switzerland (8), South Korea (6), Italy (5) and the Low
Countries (1)." Their turnover at 7,850 trillion dollars was equal to
30% of world GNP in 1995. Le Monde Diplomatique explains that in
reality the concentration is even greater than the figures indicate.
For example the world's number one company Mitsubishi owns five
companies in the top 200. Their empire pays 37% of the funds of the
Liberal Democratic Party of Japan thus completely corrupting the
political system. In South Korea, 6 of whose companies leapt into the
top 200 between 1985 and 1995, Daewoo the largest, now has a turnover
of over $ 52 billion (US), ahead of Unilever and Nestle. The largest
30 company groups in South Korea have a turnover over 4/5ths of the
country's GNP. These companies support the, "ruthlessly repression of
the working class and the liquidation of the rights of the
individual", says the report. Such dictatorial concepts pervade in the
older centres of world capital as well. The Director General of
Nestle, Helmut Maucher presides over the European Round Table of
Industrialists, the elite club of 47 companies. "An implacable
opponent of the European Social Chapter, he is an militant fighter for
the flexibility of work, like all the members of this caste". Le Monde
Diplomatique explains that the "Global Government of the
Multinationals" is run by "Totalitarian Structures". This latest
evidence of the increasing concentration of wealth and their
dictatorial hold on political and economic life, comes after the
shocking United Nations Human Development Report 1996. This revealed
that, "the assets of the world's 358 billionaires exceed the combined
annual incomes of countries with 45% of the world's people." (p2) The
UN Report showed that the idea that, "the only way to finance growth
would be by channeling the initial benefits into the pockets of rich
capitalists"...has ..." been disproved by recent evidence of a
positive correlation between economic growth and income
equality"...(p6) If there is not a radical shift towards
egalitarianism and control of the major corporations in the interests
of working people, then the predictions of the UN, of a "world
gargantuan in its excesses and grotesque in its human and economic
inequalities", will become a terrible reality. Trade Unionists and
Socialists worldwide must make it their responsibility to combine
together through computer networks which will link the unions in the
largest 200 companies together. In this way we can act to defend the
workers, protect the environment and the consumers. Unions monitoring
the activities of these companies will be able to shatter their
"Totalitarian Structures", establishing in their place direct
democratic control over decision making processes through worldwide
workers' councils.
(WNR Editorial 28-4-97) heiko@easynet.co.uk
Living and working in Eastern Europe one cannot but remember the important lessons of dependency and world system research for an understanding of what surrounds us. Income poverty has spread to a third of the population of the region - 120 million people below the poverty line of $4 a day (UNDP, 1997). As we shall analyze in more detail in Chapter 9, the pressure towards peripherization in Eastern Europe builds up, thus vindicating the more pessimistic prognosis voiced by Samir Amin (1997) about the ‘Latin Americanization’ of Eastern Europe:
Graph 1.1a: The Amin hypothesis about the Latin Americanization of Eastern Europe. Current account balances from 1992 onwards in the region - projections
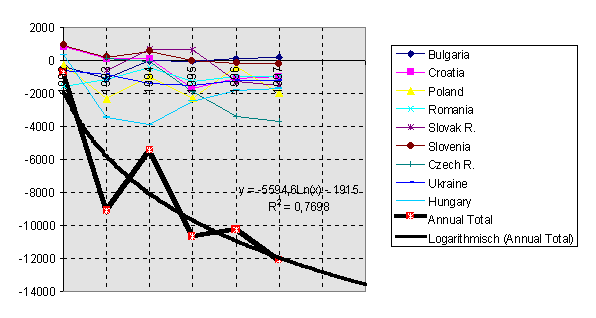
Legend: our own compilations from Bank Austria, Report, 1, 1997. Absolute values of the (projected) current account balances in East Central Europe until 1999. The lowest data series are cumulated values for the entire region.
Transnational corporations and their foreign investments are the cornerstone of the international system, as Osvaldo Sunkel so correctly foresaw in his penetrating analysis a quarter of a century ago. The outward stock of foreign direct investments of 39000 parent firms in their 270000 affiliates reached $2.7 trillion in 1995. The gross product of foreign affiliates amounted to 8.7% of home country GDP in the countries of the European Union in 1991, the last year with available data. In North America this ratio stood at 6.4%, in the LDCs at 6.5%, and in Central and Eastern Europe at 1.3%. On a world level, the TNCs control 6.4% of the world gross domestic product. In Eastern Europe, too, this relationship is on the rise, with the transnationals now controlling - through their FDI stock - up to 15.6% of the GDP of Eastern Europe, like in Hungary, 1994. The sales of foreign affiliates amounted to 116% of the total of world exports of goods and non-factor-services in 1982; this ratio now has risen to 127.9% (UNCTAD, 1996). For ages, economists have warned repeatedly against the danger of such a monopoly capitalism. Kalecki and Rothschild should be specially mentioned in this context here. An ever larger proportion of world trade is nothing but trade between the affiliates and headquarters of transnational corporations.
The international system, in addition, is not only a system of social and economic polarization, it is also a system of recurring international long-run tensions, that erupt along these socio-economic conflict lines. Ever since the days of Akerman’s pioneering study, published with Macmillan’s before the Second World War, social scientists have studied by quantitative methods the connection between economic long cycles and major wars, among them Modelski, 1987, and Goldstein, 1988. We should not forget here, as Luigi Scandella has reminded us recently, that long cycles form part and parcel of social scientific debates since their first discovery by Hyde Clark in 1847, to be followed by W. S. Jevons (1884), Alexander Israel Helphand (1901), J. Van Gelderen (1913), J. Lescure (1914), and the Russian Marxist M. I. Tougan-Baranovski, who was Kondratieff’s teacher. Akerman’s received a dangerous counterpoint by Siegfried von Ciriacy-Wantrups study, published in Berlin 1936, on ‘Agrarkrisen und Stockungsspannen - Zur Frage der Langen Welle in der wirtschaftlichen Entwicklung’. Ciriacy maintains that war is not the consequence, but the cause of economic upsurges - a theory, perfectly fitting with the official German spirit of the time (1936). However, Ernst Wagemann already showed in his study on ‘Struktur und Rythmus der Weltwirtschaft: Grundlagen einer weltwirtschaftlichen Konjunkturlehre’ (Berlin, 1931), that the real tensions in the world system arise out of the unequal spread of capitalist growth on a world scale, between what he calls the old capitalist countries with high densities of capital and labor, the neo-capitalist countries, where capital and labor are ‘relatively scarce’, the semi-capitalist nations with abundant labor and scarce capital, and the non-capitalist nations. Migration, foreign investment and technical innovations all swing along the long cycles, and the flows of migrations and investments are caused by the economic differences between the four mentioned categories (for a more detailed literature survey, see Scandella, 1998). Inequality, and not homogenization, characterize the international system.
International tension has characterized the world system since 1450 in ups and downs, that have led the world to three catastrophic world wars (Goldstein, 1988). Whether there is room for optimism now, after the end of the so-called Cold War, will be finally decided, among other factors, by the growing tension between the human species and the environment. Each day, 140 species are condemned to extinction; the CO2-content in the atmosphere is 26% higher than at the beginning of the industrial age; the earth surface was warmer in 1990 than at any point since the middle of the 19th century, when measurements began; each year, a forest area of the world as big as Finland is being destroyed, and each year, another Mexico is being added to the world’s population (World Watch Institute Report, 1992). Winter temperatures in 1997/98 in most of North America and Europe were the mildest for ages.
Rather than predicting the end of history, the acceleration of history - might loom ahead. Our work shows that there is strong evidence to believe that transnational capitalist penetration in the end leads to disintegration, and conflict, and not towards integration and peace. We use up to 19 indicators of social change since 1980 to show precisely that. Sunkel foresaw then, from the viewpoint of his structural economic theory, many of the problems that seem to beset the post-1989 world. At the time of writing this analysis, South Asia is plunged into a nuclear arms race, drug lords dominate de facto a number of countries south of the 23rd parallel and north of the 23rd southern parallel, civil wars and refugee crises dominate the international headlines of stations like BBC and CNN, which present to their listeners more than the usual parochial and limited information that is in reality so common today around the globe. Instead of heralding a better and more peaceful future, recent tendencies might imply:
A look at UNDP and UNCTAD statistics gives us a more than alarming picture of the reality of transnational integration and national, economic, social, ecological, and spiritual disintegration. In 1993, 76% of the stock of world-wide foreign direct investments were still anchored in the old industrialized countries, and only 23% in the developing countries. 40% of all investment flows between 1990 and 1994 went to the LCD’s, 4/5 of which to the top ten among the semi-industrialized or newly industrialized nations (China, Singapore, Argentina, Mexico, Malaysia, Indonesia, Thailand, Hong Kong, Taiwan and Nigeria). European leadership towards growth for the European East in an ecologically sustainable way would be one of the main tasks of rebuilding the world-economy. Between 1990 and 1994, the share of the ‘triad’(US+CND; Japan; EU) in world GNP rose from 50.3% to 50.7%; the share of the rest of Asia rose from 17.2% to 23.1%, while the participation of Eastern Europe and the ex-USSR in the world economy was nearly wiped out and reduced to half in less than a decade - from 10.9% to 5.3% of world GNP. Will Europe be able to lead the East to growth, or will - what a bleak, though nonetheless realistic scenario, the stagnation of the East between 1990 and 1994 become the future of the West of the continent (our compilations from Stiftung, 1993, and 1996)?
The wealth gaps between the rich center in Europe and the surrounding peripheral and semi-peripheral areas are part of the economic, ecological and social history over the last 500 years. They continue to exist today, and if anything, have deepened since the 1980s. In terms of most wealth indicators, as calculated by the UNDP, the East (Eastern Europe and the former USSR) and the southern rim of Europe (the Arab world), are as distant from ‘us’, the European Union, as the ‘Haves’ and the have-nots are divided from each other at any welfare border around the world, be it on the shores of the Rio Grande or across the China Sea. However, it would be wrong to be misled by wealth statistics alone. In terms of life expectancy, only 7% separate Poland, say, from Austria, while in terms of real purchasing power, the differences are estimated to be 1:4. But wealth differences create political tensions of their own, and wealth and consumption differences lead to ‘catch-up’ processes, with a structurally unbalanced development in the semi-peripheral and peripheral societies resulting in the end. Thus, from ancient societies onwards, wealth and consumption differences have lead towards a polarized form of development in peripheral societies (Chase-Dunn and Hall, 1997).
At the same time, the population balance, and the balance of military forces shifts in favor of the poorer nations, that surround the rich man’s land, the European Union, beset by a growing number of internal problems, like unemployment, drugs, crime, environmental decay, and aging populations. The following calculation from UNDP-data, 1995, shows the dramatic character of the welfare gap at the outer borders of the Union:
|
East-West-gap |
North-South-gap |
|
|
for the European Union, |
by around 1995 |
|
|
real purchasing power |
1:3.5 |
1:4 |
|
life expectancy |
1:1.12 |
1:1.22 |
|
share of world industrial GNP |
1:8.5 |
- |
|
defense expenditures |
1:6.1 |
1:1.8 |
|
population potential, 2000 |
1:0.9 |
1:1.3 |
|
military personnel |
1:1.8 |
1:1 |
|
total GDP |
1:9 |
- |
The East’s challenge to the aging north-west is its population and thus migration potential, its high military personnel ratio, but the East’s unease number one is its low share in world total GDP and industrial GNP. The South’s challenge in military terms has been building up over recent years, combined with a rapid population growth and still existing large-scale poverty. Let us hope and work for peace in the Middle East; but if that is not achieved quickly, and development in the Arab world does not reach down to the poorest strata, centuries of unequal exchange, foreign rule and neglect could combine with the archaic weight of religious tradition - then the Dar al harb, the world of war and disbelief will be held responsible for 80 million illiterates, for the 73 million poor, for the 12% of resources, spent on arms, for the scarcity of water that affects 55% of the Arabs. If the balance will not be achieved by political and economic means within the next 25 years, then migration and the military expansion of the desperate nations will attempt to redress the balance. This scenario is all the more likely, since migration pressure from the decaying center of Africa will start to push northwards in the coming years. With real purchasing power parity rates, the gaps are today:
|
Japan - East Asia (excl. China) |
1:2.6 |
|
Europe - Eastern periphery |
1:3.5 |
|
Europe - South |
1:4 |
|
North America - Latin America |
1:4.1 |
The professional political optimism of our times in Europe holds, that after overcoming the transformation crisis, Europe will re-unite and catch up with the competing market economic centers. Another vision might hold though that the inability of the East to find a proper niche in the world market might spill over to the West of the continent. Social scientific thought in the long-term policy planning and development research tradition - in Austria of Otto Bauer, Karl Polanyi, Joseph Alois Schumpeter, or Kurt Rothschild, would dare to ask, whether or not the crisis and final collapse of communism, in the end, is the product of the one and single movement in world economic dynamics away from the European landmass and the Euro-Atlantic region towards the Pacific. GDP real growth, p.a., from 1986-95 was:
|
Asia |
+7.3% |
|
LCD’s in the Middle East and Southern Europe |
+3.7% |
|
Latin America |
+2.6% |
|
USA |
+2.5% |
|
Japan |
+2.5% |
|
EU |
+2.4% |
|
Africa |
+2.4% |
|
Eastern Europe |
-1.9% |
|
CIS |
-4.2% |
Source: Stiftung Entwicklung und Frieden, 1996
Re-reading Osvaldo Sunkel’s penetrating analysis, one is struck by the parallels between the Latin America of yesterday and the Eastern Europe of today. One of the most recurrent predictions of structuralists as Osvaldo Sunkel, or Raul Prebisch, would be that a country, specializing in investment goods and other manufactures has a much better chance for long-run and stable development than nations, specializing in raw materials and semi-finished products. Samir Amin and other critics of the Union have maintained, that the structure of trade relations with the outer rim of the Union favors unequal specialization, and prolongs the periphery’s trade in raw materials and semi-finished products. Just that that seems to have been the case from 1980 to 1992:
Graph 1.1b: Structural dependence of the European East
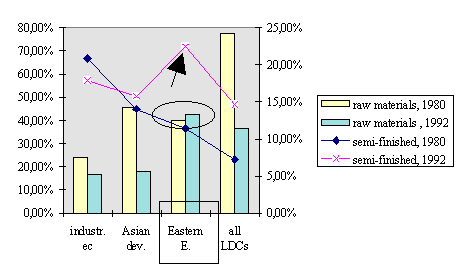
Legend: right-hand scale: percentage share of semi-finished products in total exports; left-hand scale: percentage share of raw materials per total exports. Source: our own compilations from Stiftung Entwicklung und Frieden, 1996
While other regions could advance and received a fairer share of the world market, Eastern Europe was increasingly marginalized at the very hour of liberation in 1989. More and more, there seems to be a ‘legal’ and a parallel illegal core of the world economy. What the legal economy cannot redress, the illegal economy will. The Mafias around the world have a turnover of more than $ 500 thousand million a year alone from the narcotics' trade. Each year, $ 85 thousand million in drug profits are ‘laundered’ through the financial markets. The new, speculative character of the global market economy dictates, that even legal transnationals have to earn much of their profits from speculation on the international financial markets. With that, the basic instability of the international system increases (UNDP, 1994, 1995; Stiftung Entwicklung und Frieden, 1996). Among the most powerful groups, threatening the very fabric of legal society in western countries today, are the following large illegal transnational corporations (with their estimated turnover)
|
La Costa Nostra |
(USA) |
100 thousand million $ |
|
Colombian cartels |
(Colombia) |
15 thousand million $ |
|
Italian organized crime |
(Italy) |
100 thousand million $ |
|
Cosa Nostra |
||
|
Camorra |
||
|
n’drangheta |
||
|
Sacra Corona Unita |
||
|
Yakuza |
(Japan) |
120 thousand million $ |
(Source: our compilation from Raith, 1995)
Newcomers, like the Russian, Albanian and Turkish Mafia groups, and formally regional groupings, like the Chinese Triads, are expanding rapidly as well into the core areas of the world-wide market. By the year 2020, the expansion of these and other criminal corporations will be not a threat, but a reality, practically subverting entire states of even the developed capitalist centers (Raith, 1995). The logic of accumulation of these large, transnational criminal corporations seems nowadays to reflect the growing weight of ‘flexible specialization’, while the earlier, post-1932 model reflected ‘corporatist structures’ (Behan, 1996). The ‘neo-corporatist’ structure of the classic Sicilian Mafia of Salvatore ‘Toto’ Riina is more and more superseded by flexible newcomers like the Camorra and the drug cartels of Latin America and Eastern Europe. In terms of profits, the Asian gangs seem to be on the ascent. Indeed, a relevant issue for future world systems research: the interaction between long economic and civilization cycles and patterns of the criminal underworld. The question cannot be neglected any longer by world system research: in the 1970s and 1980s, reported crimes increased worldwide by 5% per annum, in the US alone, there are now 2 million victims of violent crime every year (UNDP, 1997). The rise of crime is going parallel with the destruction of the family. Killings of minors increased in many developing countries by more than 40% in the 1990s. A third of married women in the developing countries are battered by their husbands during their lifetime. Dowry deaths in India are put at least at 5000 a year. In the US, every year nearly 3 million children are reported to be victims of abuse and neglect. 75 million children in the developing world are working in slavery, prostitution and hazardous conditions; among these 1 million girls, mostly in Asia, are forced into prostitution each year. In the OECD countries, there are now annual 129000 reported adult rapes; the prison population has increased from 80 to 88, there are now 4.8 intentional homicides, committed by male persons per 100000 inhabitants, and 1020 annual road deaths per 100000 inhabitants. The suicide rate is at 21 (males) and 7 (females); 34 annual divorces per 1000 couples are registered. The oligopolistic structure of late capitalism is now superseded by a kind of ‘Dreigroschenopera’ capitalism, begging the question of the very nature of capitalist elites that Schumpeter raised in the 1940s.
The core of the transnational economy, Sunkel observed, used to be the legal transnational corporation and the legal transnational bank. From 1991 to 1993, the following growth rates were observed:
|
world GDP |
+1.6% |
|
world trade |
+3.1% |
|
world-wide stock of FDI |
+8.0% |
|
sales of the foreign affiliates of transnational corporations |
+20.0% |
Source: our own compilations from Stiftung Entwicklung und Frieden, 1996
More than $ 1300 thousand million are shifted around each day by way of international financial markets. The cumulative debt of the developing countries reaches the staggering proportion of $ 1945 thousand million, and will tend to grow by around 1998 to $ 2600 thousand million dollars:
Graph 1.2: The debt crisis of the world periphery
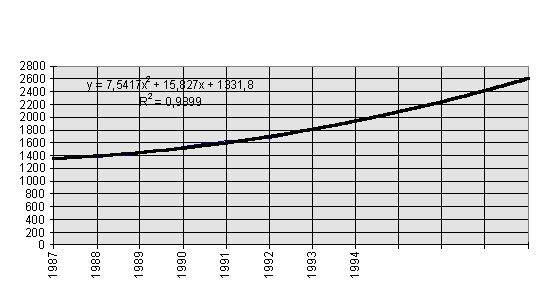
Legend: our own compilations from Stiftung Entwicklung und Frieden, 1996. Cumulated and projected values of total Third World debt, 1987 - 1998
The problem of international development, to a large extent, is also the problem of underdevelopment and poverty, in which a large part of the malnourished children of this world grow up - 11 - 19 countries, which, in addition, have to shoulder a large part of the world refugee problem as well:
Table 1.1: The 11 - 19 main crisis points in the world system
|
refugees in thousands |
malnourished children in millions |
||
|
Iran |
2495 |
1,64 |
|
|
Philippines |
3 |
3,024 |
|
|
Indonesia |
2 |
8,768 |
|
|
China |
288 |
19,317 |
|
|
Vietnam |
5 |
4,413 |
|
|
Myanmar |
2,326 |
||
|
Pakistan |
1480 |
9,409 |
|
|
India |
260 |
61,775 |
|
|
Nigeria |
5 |
6,975 |
|
|
Bangladesh |
199 |
10,994 |
|
|
Ethiopia |
248 |
4,749 |
|
|
Rest LDCs |
6805 |
23,55 |
|
|
Country |
estimated number of poor people |
|
according to the capability-poverty-measurement-scale |
|
Mexico |
14,5847 |
|
Brazil |
15,16 |
|
Turkey |
12,1264 |
|
Thailand |
11,6894 |
|
South Africa |
11,8256 |
|
Philippines |
18,3744 |
|
China |
204,8725 |
|
Iran |
17,8502 |
|
Algeria |
12,672 |
|
Indonesia |
79,3971 |
|
Morocco |
12,7729 |
|
Egypt |
23,4232 |
|
Pakistan |
73,872 |
|
India |
530,5605 |
|
Tanzania |
10,5986 |
|
Zaire |
17,2542 |
|
Nigeria |
57,8436 |
|
Bangladesh |
89,5116 |
|
Ethiopia |
36,0314 |
|
Rest |
172,2797 |
Source: our own calculations from UNDP, 1996. Figures for South Asia are printed in bold letters
The incomes of more than a billion people have fallen below levels first reached 10, 20, sometimes 30 years ago (UNDP, 1997). Between 1987 and 1993 the number of people with incomes of less than $1 a day increased by almost 100 million to 1.3 billion, and the number appears to be growing in every region except East and South-East Asia and the Pacific. In the past year, the Human Development Index dropped in 30 countries (UNDP, 1997). The share of the richest 20% in world incomes rose from 70% to 85%, with the differences between these two rising from 30:1 to 61:1 in 1991, to reach 78:1 in 1994 (UNDP, 1997). The share of the poorest 20% of the world’s people in global income now stands at 1.1%, down from 2.3% in 1960. Even in the developed core countries of the world economy alone, 80 million people are categorized as poor with less than $14.40 a day in 1985 PPP$ (the US poverty line), and at least 30 million are homeless. In the United States of America, 47 million people have no health insurance. In Eastern Europe, the introduction of ‘turbo’-capitalism brought about 2 million extra deaths, caused by violence and the sharp increase in cardiovascular diseases. In the Federal Republic of Germany alone, 900000 people are homeless, 10.9% of the total workforce have no job, and 7.5 million are poor (Orientierung, 60, 1996: 204; IFRI, 1998). Between 1989 and 1996 the number of billionaires - world-wide - increased from 157 to 447. The net wealth of the richest 10 individuals on our planet is 1.5 time greater than the total annual income of all the least developed countries of our globe with 534.2 million inhabitants. The richest single individual in Mexico had a bigger wealth than the annual income of 17 million of his compatriots.
Nollert (1990), based on Berry et al., has shown, that the share of the bottom 60% in world consumption, after due consideration to income distribution within the nations of the world, is 11.9%, while the share of the top 10% is 50.5%. The wave of the world recession - or as we prefer to say, the Kondratieff B-phase - first hit Africa in the 1970s, and rolled on to hit Latin America and the Arab world in the 1980s and Eastern Europe in the 1990s. Even in the highly industrialized countries, capitalist development became more and more
(i) jobless: in the countries of the European Union in 1993, there were 16.86 million unemployed people. In the industrial countries as a whole, there are 30 million people out of work.
(ii) ruthless: global GNP grew by 40%, but the number of poor grew by 17%. In the European Union, the ratio between the richest 20% and the bottom 20% is now 7.5 in France, 9.6 in the UK, 7.1 in Denmark, 5.8 in Germany, and 6.0 in Italy. Each year, damage to forests due to air pollution leads to economic losses of about $35 billion - about the annual GDP of Hungary.
(iii) voiceless: human and political rights performance on a global scale has deteriorated in many countries according to the well-known Freedom House data series (Stiftung, 1997); even in the countries of the European Union, the following performances in 1996 were below the maximum value ‘1’, in the Spanish and British case under the weight of the fight against regional, primordial terrorism in the Basque country and in Northern Ireland
|
Belgium |
2 |
|
France: civil rights |
2 |
|
Germany: civil rights |
2 |
|
Great Britain: civil rights |
2 |
|
Greece: civil rights |
3 |
|
Irish Republic: civil rights |
2 |
|
Italy: civil rights |
2 |
|
Northern Ireland-political rights |
3 |
|
Northern Ireland-civil rights |
4 |
|
Spain: civil rights |
2 |
The poorest 40% in the EU countries receive only 18% of total incomes. Women receive on average only 2/3 of the income of males; and hold only 12% of parliamentary seats
(v) futureless: annual fresh water withdrawals amount to 862 m^3 in the Union. Commercial energy use in oil equivalents is 3588 kg per capita in oil equivalents, and each year, the Union produces 15.13% of the world’s greenhouse gas emissions, 3373 metric tons of heavy metal from nuclear reactors, and 48220 tons of hazardous highly-toxic waste. The average Union citizen produces 399 kg of municipal waste a year, and recycles only 45% of his or her paper and 52% of his or her glass. 2 million people are already affected with HIV.
Instead of an end of history, global or regional anarchy in countries like Afghanistan, Albania, Angola, Burundi, Georgia, Kampuchea, Liberia, Mozambique, Rwanda, Somalia, Sudan, Tajikistan, and Yemen, seems to be likely. A global financial crash cannot be ruled out entirely. In a very brilliant commentary, Rudi Dornbusch thinks that repetitions of the Mexican crisis - or rather Peso disaster for the world economy - are likely again and again (Dornbusch, in Business Week, November 25th , 1996). Recent experience in Brazil, Indonesia, Malaysia, the Philippines and Thailand, where the negative current account balance went out of proportion, underlines his point. The ghosts of this ‘tequila effect’ or ‘caipirinha-effect’ walk around Eastern Europe, too.
The capacity of the US to act as a global policeman under such circumstances is severely constrained by the secular balance of trade deficit of the US economy, not being offset by an enough positive balance of services and payments. Indeed, the outflow of hegemonic capital after each hegemonic period is a well-known phenomenon and in the end explains very well, why American capital today will have no tendency to restore the US economy at home. The comparative characteristics of hegemonic decline were always, Chase-Dunn and Hall teach us, secular balance of payment deficits. America is no different from Britain, the Netherlands, Genova and Venice before in the history of the world economy.
Hundreds of millions of human beings are unemployed or under-employed on a world scale. Even in a highly social-policy-oriented country like Austria, which ranks 13 among the 174 nation list of human development and the 137 nation list of gender development, and 10 among the 104 nation list of gender empowerment, net earnings from profits and property are now 29.4% of national income, the state withdraws and has a share of 27.7% in net national income, and net total wages are down to 43.3% (Federal Ministry of Labor and Social Affairs, Social Report Austria, 1995). This tendency for relative wages to fall in relation to profits, property and the state, seems to be universal. There are reliable income distribution data available from 68 countries. In 29 nations, the ratio of the top 20% to the bottom 20% exceeds 10 to 1; in 17, 15 to 1; and in 9, 20 to 1. The 1998 HDR of the UNDP estimates the most glaring contradictions of the inequality in consumption the world over. The additional annual cost to achieve universal access to basic educational services in all developing countries would be 6 billion US $; the annual expenditures for cosmetics in the USA is 8 billion US $; water and sanitation for all in the Third World would require 9 billion $ annually, while ice cream consumption in Europe is 11 billion $ annually. The annual expenditures necessary for basic health and nutrition in the Third World are 13 billion $, while pet food consumption in the USA is 17 billion $ and cigarettes in Europe 50 billion $ (UNDP, HDR, 1998). Government subsidies in agriculture, energy, water, and road transport total US $ 700-900 billion annually, and they considerably increase inequalities further. At the same time, a considerable percentage of people is thrown into poverty by the workings of the process of globalization:
Graph 1.3: poverty data for the European Union (poverty threshold is 50% or below of average consumer expenditures on a Union-wide level) and the Human Development Index
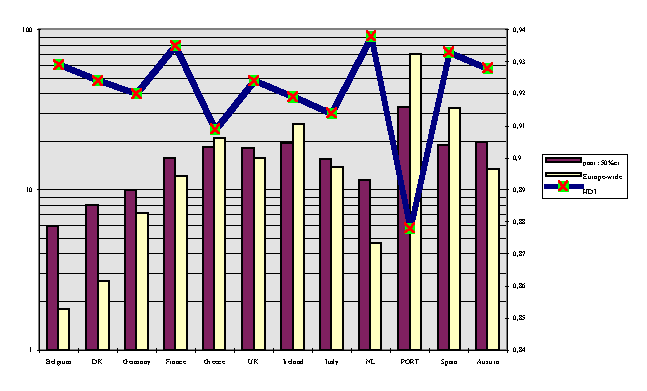
Source: comparative European Union poverty data, as compiled by the Austrian Federal Ministry of Labor, Vienna. Left-hand scale (bars): percentage of people, considered to live in poverty; right-hand scale (line): Human Development Index (UNDP).
The notion of full employment, once the objective of economic policy making, together with monetary stability, economic growth, social justice, ecological and external equilibrium, is a thing of the past. At the same time, dependency ratios are sharply rising, so that the percentage of people world-wide engaged in productive work is stagnating or even falling.
2) The theoretical framework: what can policy-makers know about ascent and decline in the world economy?
Dependency and world system theory hold, that poverty and backwardness in poor countries are caused by the peripheral position that these nations have in the international division of labor. Ever since the capitalist world system evolved, there is a stark distinction between the nations of the center and the nations of the periphery. Cardoso summarized the quantifiable essence of dependency theories as follows:
Already the classics of political economy provided a framework of quantifiable dependency theory. Let us recall that for Marx and his labor theory of value, total product consists of constant capital, c, variable capital (labor), v, and surplus, s. Rate of surplus value, s’, the organic composition of capital, q, and the profit rate, p, are hence:
Class relationships of a rising power of labor in the centers determine, that, in the end, long-term fluctuations notwithstanding, cheaper raw materials and exploitation of the periphery become one of the cornerstones of a strategy to halt the fall in the profit rate. Among others, mass migration, unequal exchange, and a new international division of labor are key elements to increase, at least temporarily, s’. Kalecki adapted political economy to the age of monopolization. Let gross production be P, W are wages, M are the payments for raw materials. The monopolization factor is k. We are in a situation of less than full employment. Costs for wages, W, and raw materials M, are multiplied by a factor of k (k > 1) to arrive at prices. The gross value of production of an enterprise is thus
A rising degree of monopolization in the leading center countries over time determines, that, in order to keep the share of wages at least constant, a rising exploitation of the raw material producers sets in to offset the balance. There is a massive, internationally published evidence that speaks in favor of dependency theory. Kalecki and Rothschild are vindicated by contemporary developments in transformation economies: transfer pricing alone costs - according to Polish Treasury experts - the Polish economy 8 billion Zlotys a year (approximately $bn 2.29; Zycie, 92, 20th of April, 1998: 15). Finance Minister Balcerowicz now reckons that consumption rises twice as fast as productivity, and Planning Chief Kropiwnicki thinks that the high trade deficit threatens macro-economic stability (Rzeczpospolita, 91, 18th - 19th April 1998: 9).
The almost unlimited number of empirical studies on peripheral capitalism and development on a world level in the B-phase of the Kondratieff cycle from 1965 onwards go back, in a way, to the classic essay, published by Johan Galtung in the spring issue of the Journal of Peace Research a quarter of a century ago (Galtung, 1971). For Galtung, income inequality, and hence, relative poverty in the nations of the world system is linked to trade partner concentration of the peripheral country and a trade structure, that relies on the exports of raw materials and the imports of finished products. Bornschier, Chase-Dunn, and their school later on reformulated the argument: not only income inequality, but also long term economic growth are being negatively determined by dependency from transnational capital, to be measured by a weighted share of transnational investment penetration per economic and social size of the nation. Later essays extended the argument to other indicators of human well-being and the environment as well as democratic stability.
Other formulations of dependency insisted on ‘unequal exchange’ which, according to one such formulation, hampers development if double factorial terms of trade of the respective country are < 1.0 (Raffer, 1987, Amin, 1975). Labor in the export sectors of the periphery is being exploited, while monopolistic structures of international trade let the centers profit from the high prices of their exports to the world markets in comparison to their labor productivity. Since double factorial terms of trade are simply net barter terms of trade weighted by productivities (F) of X, exports, and M, imports, the formula
(2.7) ((PX * FX)/(PM*FM)) = 1 denotes the conditions of ‘equal’ exchange as opposed to unequal exchange:
(2.8) ((PX * FX)/(PM*FM)) = < 1.0 while nations with
Empirical support for Raffer’s reformulation of the theory of unequal exchange is overwhelming. Since the early 1970s the least developed countries have suffered a cumulative decline of 50% in their terms of trade. If terms of trade in 1987 are 100, the 1994 values indicate
|
Sub-Saharan Africa |
95 |
|
South Asia |
97 |
|
East Asia |
104 |
|
South-East Asia and Pacific |
94 |
|
Latin America and Caribbean |
96 |
|
least developed countries |
91 |
|
Industrial countries |
104 |
For the developing countries as a whole, terms of trade losses between 1980 and 1991 amounted to $bn 290 (UNDP, 1997). Real commodity prices were 45% lower than in 1980 and 10% lower than the lowest prices during the Great Depression, 1932 (UNDP, 1997). Interest rates for credits of the developing world were in effect four times as high as those charged on rich countries during the 1980s. Goods from the developed countries enjoyed much greater tariff reductions in the Uruguay Round than those from developing countries - 45% compared with 20-25%. The least developed countries face tariffs that are 30% higher than the global average (UNDP, 1997). Tariff escalation forces developing countries into primary commodities, whose real prices are declining. For developing countries, tariffs will be higher for final products. The discrimination of LDC textile exports continues, while subsidies to agriculture in the rich countries keep world prices low and exclude the Third World from the food markets of the rich countries. It confronts domestic food producers in the poorer countries with cheap food imports, which reduce the incentives for local food production and destroy the livelihoods of millions of peasants (UNDP, 1997). This is the real crisis of agriculture in Africa, but it also affects agriculture in East Central Europe. We Westerners tend to think of Polish agriculture in terms of backwardness, but we underestimate the peripherization, that we impose by our subventions and trade barriers on Eastern European agriculture, and in the long run, also on employment in the under- and semi-developed regions of the East.
By a reduction of agricultural subsidies by just 30%, LDCs could earn an extra $bn 45 a year. Unequal access to trade, labor and finance costs the periphery up to $bn 500 a year, 10 times the amount of the yearly overall international foreign assistance (UNDP, 1997, 1992). Intellectual property rights increase the price of technology, while the USA in the 19th Century and Japan in the 20th Century enormously benefited from the free flow of ideas (UNDP, 1997).
Skepticism about the expanding world order, dominated by the transnationals, as a tool for achieving stable market-oriented development persisted, the neo-liberal transformation literature in the wake of the earthquake of the revolution of the year 1989 in Eastern Europe and the breakdown of communism notwithstanding (Aslund, 1992; Sachs, 1993). The fall of the Berlin Wall is a good testing ground for various theories of development and social decay: what really happens, if ‘capitalism’ has ‘its way’?
Giovanni Arrighi proposed in his provocative analysis of the ‘Long 20th Century’ (1995) the thought that the logic of accumulation on a world-scale is governed by the ups and downs in the succession of regulation and de-regulation, starting from the Venetian (regulatory) and Genoese (deregulated) era of capitalism, followed by the Dutch (regulatory) and British (deregulated) era, and the US hegemony, which - after 1945 - was a regulatory model. From the late 1970s, however, we witness, Arrighi’s argument goes on, again the renewed rise of a deregulated model of world capitalism. The often bemoaned end of the Keynesian era has its real basis, Arrighi’s argument goes, in the shifting accumulation pattern of world capitalism. We agree with Arrighi that the rise of financial capitalism and the decline of productive capitalism are always connected to major shifts in the location of the centers of world capitalism, first from Venice to Genoa, followed by the shift from Genoa to Amsterdam, from Amsterdam to London, from London to New York, and from there on to the capitalist archipelago of East Asia of yesterday, perhaps to be followed by South Asia today (Arrighi, 1995). Arrighi also introduced the important notion, that there is a certain coexistence in the time-perspective between the ‘different logics’, so that elements of the waning and elements of the emerging order might coincide for years. Arrighi’s sequential model of world capitalism is also a historic interpretation of the old Marxist notion of financial expansion - > material expansion- >financial expansion (MCM’), and as such radically challenges the notion of ‘unchanging’ general laws of rise and decline. Following Arrighi, we postulate that regulatory strategies might have been well compatible with growth under the rise of the Venetian, Dutch, and American era, while at the time of the rise of ‘deregulation’, such deregulatory strategies and not ‘big government’ will be conducive to economic growth.
There were dozens of articles being published on these 'laws' of development in world society, with the quantitative dependency argument perhaps most clearly having been stated by Bornschier and Chase Dunn in 1985. Their widely received book still can be considered as the quantitative canon or summa of arguments about the workings of domination and dependence in the capitalist world economy put forward over the years by such different authors in such different countries at such different points of time as Herb Addo (before his untimely death in Trinidad); Samir Amin (now Senegal); Volker Bornschier (Switzerland); Fernando Henrique Cardoso (now the president of his home-country, Brazil); Christopher Chase-Dunn (USA); Armando Cordova (Venezuela); Steffen Flechsig (Neue Bundeslaender); Andre Gunder Frank (now Canada); Folker Froebel, Juergen Heinrichs and Otto Kreye (Germany); Walter Goldfrank (USA); Björn Hettne (Sweden); Otmar Hoell (Austria); George Kent (Hawaii, USA); Kimmo Kiljunen (Finland); Kari Levitt-Polanyi (Canada); Kunibert Raffer (Austria); Robert Ross (USA); Kurt Rothschild (Austria); Dieter Senghaas (Germany); Robert Stauffer (Hawaii, USA); Jadwiga Staniszkis (Poland); Hanns-Albert Steger (Germany); Osvaldo Sunkel (Chile); Henryk Szlajfer (Poland); Immanuel Wallerstein (USA); Edward L. Wheelwright (Australia), being joined by the quantitative debate in such journals as American Journal of Sociology, American Political Science Review, American Sociological Review, Social Forces, and many others.
The basic questions that we formulate are then:
The second 'Great Transformation' of our century, that from socialism back to the world-wide market economy, can be seen in the perspective of the specific globalization aspects inherent in the writings of Karl Polanyi: a Polanyian world view would hold, that authoritarian socialism in Eastern Europe crumbled like the old Hapsburg empire back in 1918, under pressure of the world market, that democracy had a chance in the region, as it had from 1918 onwards, but that this new chance, as the one in 1918, is now being at stake. For followers of the globalization school, Polanyi's anthropology in a way foresaw the destabilization, the nationalist warfare, the unemployment, the international conflict, the social decay, and the more than 800000 excess mortality cases since the transformation in the whole of Eastern Europe and the former USSR, as Cornia's UNICEF study so aptly put it in 1994. These phenomena also, the argument goes on, imply why in the East the lessons of 'critical' development theory should remain on the agenda. Political turmoil continues in some regions of Eastern Europe and the former USSR 9 years after the transformation, and transnational crime from the East and the South has become a very serious negative factor in international relations. In terms of real income growth over time, practically only Poland had up to now a successful transformation from socialism to capitalism, while all the other nations of the East have fallen behind (WERI, 1997). Indeed, it is even plausible that the old big-power rivalries will continue under the new banner of culture and nationalism. Only four of the seventeen countries that adopted democracy during the Kondratieff cycle B-phase between 1915 and 1931 could save democracy; and today, freedom in the world is again on the retreat while violence and repression is on the increase. At the end of 1993, only 57.5%, that is, 107 out of 186 UN member countries had competitive elections and various guarantees of political and human rights (Lipset, 1994: 1).
Small nations in the world economy might find it difficult to get access to bigger markets. That is one of the main themes of dependency theory. Where dependency theory differs from later world system research, is its relative neglect of the role and trajectory of the centers. In Western Europe, unemployment and early retirement rose dramatically, while in the USA there was a considerable withdrawal from the labor force into crime, to be followed today by working poverty and the creation of 13.5 million jobs (Wood, 1994). The institutional greater flexibility of wage labor in the US still allowed for a better employment creation record than in Western Europe, with both major regions of developed capitalism being affected by trans-border migration and a growth of the shadow economy. The South's official exports of manufactures to the developed countries have meanwhile risen to $ 250 thousand million a year, and the developed countries' and East's industrial labor intensive base shrinks rapidly. That there is a new international division of labor seems to be increasingly out of the question. The cumulative effect of the expansion of trade in manufactures and services with the South reduced the demand for unskilled labor in the developed countries and the East relative to skilled labor. In the developed countries, this amounts to a 20 percent reduction in the relative demand for unskilled labor (Wood, 1994). Transnational capital and its tendency to re-deploy the sites of production world-wide is seen by the theories of neo-dependency and international division of labor as the basic underlying cause of the crisis in the developed countries themselves (Froebel et al., 1977-86; Ross and Trachte, 1990; Tausch and Prager, 1993). Wage and personnel side costs in industry per hour in a country like the Federal Republic of Germany (alte Bundeslaender) or Sweden exceed those in the United States of America by a ratio of approximately 2:1, those in a country like Turkey by a ratio of 6:1 (Weltalmanach, 1995: 989-990). Automatization, work robots, rationalization and personnel reduction are the answer of capital vis-à-vis the high labor costs in industry in some leading industrialized countries.
Neo-dependency and world system schools (which in terms of development theory never reached the originality of dependency approaches, see Tausch and Prager, 1993) would fear, that the most recent tendencies of world capitalism will strongly work against high female employment and create female unemployment, and they would especially expect two hypotheses to hold (i) transnational capital marginalizes female labor power (ii) the dynamics of growth turn away from those countries, where women still have a strong position on the labor market. The measurement scale, compatible with such hypotheses, would be the share of women in total employment and its trade-off with growth rates. The new indicator series, first developed by the UNDP for the UNO-Women-Conference in Beijing 1995, provide a further testing ground for the different feminist social theories of world development.
Our main operationalization of the concept of dependence will consist of MNC penetration, measured by the UNCTAD-time series on the share of inward FDI stock in gross domestic product from 1980 to 1994, and it will also consist of the more traditional indicators of dependency, like terms of trade or trade dependency. The main theoretical expectation of the refined globalization model in the tradition of Cardoso can still be summarized as follows:
(2.10a) structural imbalance of the development process (like high polarization of income distribution, insufficient human development, political or human rights violations) = constant + b1 * MNC penetration index + b2 * trade dependency index - b3 * terms of trade index
while 'classic' small state theories and early macroquantitative studies of development in addition would expect:
(2.10b) economic growth = constant - b1 * MNC penetration index - b2 * trade dependency index + b3 * terms of trade index
The presentation of the liberal and socio-liberal counterpositions to the dependency approach will be rather condensed: the basic problem of institutional reform in the less developed part of the world economy is the creation of a market economy, based on private property in the framework of democracy. Over recent years, the liberal doctrine challenged the near dominance of globalization-paradigms in international social science that was evident in the late 1970s and the early 1980s. From the viewpoint of critical development thinking, Griffin forcefully presented the points to be conceded to the ‘deregulation’ perspective recently (Griffin, 1996). Market imperfections in the banking and labor market sectors must be abolished; human capital formation - in short, ‘investment in people’, must take a priority. Seen in such a way, there is no real contradiction between dependency theory and a socio-liberal model, as Griffin and Tausch/Prager have extensively shown.
First of all, there is a certain structural similarity between many of the arguments from dependency theory and liberal development theory, once you 'translate' one theoretical language into the other and vice versa. As the Economist paper put it so aptly on October 26, 1996:
‘although some investment can be financed by foreign money, high savings rates will be needed to pay for the accumulation of capital and thus to boost growth rates’
For a true liberal economist, dependency is a special situation of the typical constraints, caused by a policy of import substitution and export discrimination. Policies, that create double deficits (huge current account balance deficits + large state sector budget deficits) and discriminate against internal savings, will lead to a high propensity to import foreign capital, often still aided by de-iure or de-facto policies that prevent enterprise creation and savings mobilization. The growing peripherization of Europe should be mentioned in this context. Neo-classical economists would agree with ‘dependentistas’ in their critique of import substitution strategies, currency overvaluations, and - hence - the discrimination against exports to the benefit of the urban sector and to the detriment of rural society. The basic argument of such a sophisticated version of the neo-liberal school further runs as follows: in world politically stable countries with long recognized international borders, narrow distribution coalitions emerge in the wake of too big a state sector influence, and they will thwart growth perspectives and bring about stagnation and unemployment. High real appreciation of the national currency (Poland + 9% 1990-94) declining private savings rates (Poland: 12.4% growth rate of private consumption), inadequate investments in the tradable sector, low export growth rates compared to imports, high official current account balance deficits per GDP (estimated by some economists to be unsustainable when half the numerical value of the export growth rate or bigger), a growing reliance on short-term capital flows and large currency exposures are all too well known to both neo-classical economics and dependency theories alike (Dadush and Brahmbhatt, 1995). Export growth in the European Union 1980-1993 was only 87 percent of import growth (UNDP, 1996).
In addition, the state and its economic activities (EU: central government expenditure per GDP 43 percent, USA: 24 percent) will be most harmful in older democracies due to the unhalted workings of the mechanism of narrow distribution coalitions. For liberals and partially converted neo-Marxists like Griffin alike, double-deficits also are a key towards understanding the distortions on the capital markets. These distortions, the argument goes, are just as important as rigidities on the labor market in blocking economic growth (Griffin, 1996: 146). Measured in terms of central state sector expenditures per total GNP, the average European Union country today is more ‘socialist’ than most former communist states. Even in the UK, after years of conservative rule, 39.9% of GNP in 1994 was controlled by the central government in London, a figure, which does not include expenditures by government in the broader sense in the municipalities et cetera. True liberals would not preclude, that distribution coalitions indeed foster situations, where imported capital plays a predominant role in an economy.
What might be politically valid for old democracies like New Zealand or the United States, does not necessarily hold true for a young democracy like Spain after Franco or Poland after the downfall of communism.
Neo-liberal cross-national studies of growth and development tended to conceptualize ‘systems age’ or ‘age of democracy’ by the number of years, that a polity enjoyed without changes to the externally recognized borders and in the framework of the establishment of free and competitive elections to the legislative chamber(s) (Weede, 1985-1992). Our operationalization of the concept of system's age is sometimes also the concept of the strength of international distribution coalitions: 'years of United Nations membership of a state', to account for the ‘internationally recognized’ position of a country in the international community. It must be emphasized however, that an interpretation along the lines of Samir Amin’s dependency theory is also possible: for Amin, the distinctive feature between the center and the periphery, inter alia, is the early development of a bourgeois state. Thus, the power position as a distribution coalition broker in the international system is being measured:
(2.11a) stagnation = constant + b1 * age of the international post-war system participation + b2 * national state sector influence (like state sector expenditures per GDP)
or, on a world-scale:
(2.12b) stagnation (in the countries of the world system) = constant + b1 * chance for distribution coalitions to arise (years of UN membership) + b2 * state sector influence (like state sector expenditures, government consumption per GDP or share of public investment per total investment) - (b3 * proper internal and external conditions for the defense of democracy (a firmly entrenched democratic system and a stable integration into the Western security zone)) - b4 * cultural preconditions (like the Huntington Index)
Linnemann and Sarma developed a model, whereby the linkages between external and internal constraints further underline the basic similarity between neo-liberal and dependency approaches. Let CA denote the current account balance, NFP net factor payments, NTR net transfers, C consumption, I gross domestic investments, S gross domestic savings, T government revenue, G government expenditure, X, exports, M, imports, NFA net foreign assets, DS foreign debt, K reserves, L liabilities, let DYN symbolize growth, GDP gross domestic product, GNP gross national product, let the subscript g denote government, p, the private sector, f foreign countries, so we have
(2.12c) CA = (GDP + NFP + NTR) - (C + I)
(2.12d) CA = (C + S) - (C + I)
(2.12e) CA = ((Cg + Sg) - (Cg + Ig)) + ((Cp + Sp) - (Cp + Ip))
(2.13f) (T - G) + (Sp - Ip) = (X + NTR + NFP) - (M)
(2.14g) (T - G) + (Sp - Ip) = DYN NFA
(2.14h) DYN DS = DYN K + L - If - CA
Privatizing rapidly public enterprises might lead reform countries - given rigidities of supply - even to higher inflation rates, while the effects of the liberalization of prices and the cut-back on government subventions will be only a more short-term improvement in the current account balance. Reconstruction makes necessary investments which by far exceed savings, and hence, the current account balance will deteriorate again.
Ever since the classical political economy of J.S. Mill, socio-liberal reformers have maintained the compatibility of social reform and market economic/capitalist growth. The official social doctrine of the Christian Churches, in Latin America especially the Catholic Church, in some aspects uses similar arguments - from Pope Leo XIII to John Paul II, with liberation theology at any rate advancing the viewpoint of non-violent salvation and liberation, justice and community (Brackley SJ, 1996: 117). In a world, where structural adjustment, Maastricht and other similar concepts dominate the scholarly horizon, at least in the West, liberation theology, with its emphasis on the two millenia old beatitudes of the Sermon of the Mount, on Yahweh, the God of the poor, and the Hebrew concepts of hendiadys (steadfast living-kindness) and sedeq (justice for the oppressed) turns development theory on its head (Brackley SJ, 1996: 129). The rich literature of liberation theology draws parallels between the LDCs today and landlessness, debt, unemployment, heavy taxes, hunger and malnutrition suffered by the mass of the people in Galilee two thousand years ago. It is a conscious effort at re-discovering the social commitment of these traditions; non-violent protest movements, that empower people, are certainly corresponding to the spirit of liberation theology and the Judeo-Christian gospel (Brackley, 1996: 153-155). The Catholic Church magisterium (official teaching) has been more in line with traditional, ‘top’ to ‘bottom’ visions of the state and of organizations as actors, delivering and inter-mediating goods and services in favor of the poor, although Vatican pronouncements were also very frank and forwardlooking in defending landless laborers and the poor in general (see especially John Paul II, 1988, 1991a and 1991b).
Already in his famous macro-economic model, Nicholas Kaldor explained the conditions of growth of a capitalist economy in the postwar-period: mass demand. If mass demand is seriously undermined by the process of globalization, we are back to the long-term stagnation traps of 19th Century capitalism. Let total product Y be the sum of wages, W, and profits, P, let there be the identity between savings and investments, I = S, and let us divide the savings rate S into savings out of workers’ incomes and out of profits, and let savings of workers Sw be proportional to wages and savings of profit income recipients Sp be proportional to profits, we arrive at the final, but still tautological formulation, that profits are a function of investments:
At given propensities to save out of profits and wages, the profit rate is a function of investments. On the way to a model of the real economy in the postwar period, Kaldor now says, that real wages have to be above subsistence wages, the profit rate must not fall below a certain minimum, the share of profits is institutionally determined at least at a certain minimum, and the capital output ratio must not be influenced by the profit rate. Only these conditions, Kaldor thinks, assure that the clear causal relationship between investment and profits holds. Else, especially, when wages fall down to the subsistence level, the Keynesian mechanism to guarantee full employment will not be in force anymore, output will be limited by available capital, and not by labor, and finally, the classic and not the Keynesian adjustment mechanism will be in operation: the surplus, available for investment, determines investments, and not investments savings.
Capitalism must have a long-term interest in wages in order to survive. This is also the reason, why, of lately, there is a growing concern in the international press about the effects of globalization on mass demand. There are common denominators for a reform-oriented social policy program: a leading variable, of interest to this school, will be social security benefits expenditures per GDP in the contemporary period. The social insurance program experience index measures the social security experience of a nation during the earlier Kondratieff cycle as a precondition for contemporary growth.
Some authors in the tradition of this 'social policy approach', summarized in a statement by Nancy Birdsall from the World Bank before the delegates of the Social Committee, UN General Assembly, October 19th, 1992, would also expect a very strong negative relationship between development performance and population growth. Throughout his academic and political life, Myrdal emphasized this point of development theory, thought to be so important for the structure of labor markets, income distribution, and economic growth. Apart from that, human capital formation and the patterns of human ecology and the use of scarce natural resources, all connected with the population issue, are of relevance for this approach (Tausch and Prager, 1993). The anti-natalist view, however, is not shared by the mainstream of Catholic social reform thinking.
The liberal corporatist school, an important sub-school, which draws its experience from the post-war development of countries like Sweden or Austria, treats the combination of world economic openness (trade dependency index) with a democratic political regime (for example a low index of violations of civil and political rights) as an ideal mix, conducive towards political compromise and a partial alliance between capital, wage labor and the state. It expects positive trade-offs between world economic openness, democracy and social policy on the one hand and economic and social performance on the other hand. Katzenstein was most prominent to formulate such a theory (1984); others, most notably Schmidt, 1986, and Munoz, 1982, followed suit. According to the social policy approach, markets always need the element of existing and functioning social safety nets. Rent seeking is a reality, but it is a process that in the end redistributes incomes upwards and wastes economic resources. By concentrating social policy on the real needy and poor sectors of society, an impetus can be created to cut government expenditures in other areas.
By way of summary, a social and ecological reform theory would expect at least:
(2.4) pace and level of development = constant - b1 * increase of fertility rates 1960-90 (UNDP, 1993/94) + b2 * social insurance program experience index (or social security benefits expenditures as % of GDP) + b3 * share of women in the membership of national legislature or other measures of gender development - b4 * total fertility rate - b5 * share of richest 20% in total incomes + b6 * trade dependency index
3) The international environment is basically unstable. A survey of the contemporary research methods for the study of changes in the world system since 1989
International social science since the mid-1960s studied patterns of international development in a cross-national perspective. This movement towards retrievability of research results, based on statistical analysis with internationally available and recognized data, which was initiated, amongst others, by the late Karl Wolfgang Deutsch from Harvard University, had important implications for international social policy. It allowed for the rigorous testing of hypotheses, contested in the political arena in an often passionate fashion.
The methodological innovation of this work is mainly the combination of cross-national development research with research about cyclical trends in the world economy. Cyclical trends in the world economy are certainly not absent from a very long tradition of scholarship in political economy, beginning with Kuznets and Schumpeter. The very logic of industrial processes and basic innovations, as well as the societal models, connected with them, would suggest to build cyclical fluctuations into more general theories of development (Amin, 1997). Blast furnaces and other important components of the industrial process, too, have a certain life-cycle, comparable with the Juglar and Kuznets cycle, just as technical innovations are scattered in a non-random fashion along time, coinciding with the Kondratieff cycle (Bornschier, 1988; for a recent and very comprehensive summary Scandella, 1998). There are, as we already said, short term instabilities of 3 to 5 years (Kitchin cycles), 8-11 years (Juglar cycles), 18-22 years (Kuznets cycles), and longer, 40-60 year Kondratieff waves. The following dating scheme could be suggested in the light of the Schumpeterian theory tradition (Scandella, 1998). Global capitalism since 1740 has the following Kuznets cycles:
|
1741-1756; R^2 = 23. 5% |
|
|
1756-1774; R^2 = 36. 1% |
|
|
1774-1793; R^2 = 34. 8% |
|
|
1793-1812; R^2 = 39. 7% |
|
|
1812-1832; R^2 = 16. 4% |
1. Kondratieff |
|
1832-1862; R^2 = 25. 7% |
|
|
1862-1885; R^2 = 36. 3% |
2. Kondratieff |
|
1885-1908; R^2 = 56. 2% |
|
|
1908-1932; R^2 = 44. 2% |
3. Kondratieff |
|
1932-1958; R^2 = 19. 1% |
|
|
1958-1975; R^2 = 68. 8% |
4. Kondratieff |
|
1975-1992; R^2 = 66.2% |
5. Kondratieff |
Our attempt to estimate the determinants of world economic and social development from 1980 onwards tries to be based in this tradition. The UNDP Human Development Reports, our main new data source, emerged over the years as one of the leading socially relevant data collections for cross-national research; the wealth of data contained in them shows concern for the global environment and for social decay and by far exceeds in quality other comparable products on the market today. The choice of the time period corresponds to the Kondratieff-type long cycle theories, that are presented below.
Our data sources for the study of this latest phase in the evolution of transnational capitalism relied at least in part also on Fischer Weltalmanach; Nohlen; Seager and Olson and Stiftung Entwicklung und Frieden, which are excellent data handbooks for the study of international relations. Some data were also cross-checked with Tausch, 1993, 1994; UNECE; UNICEF (Cornia, 1993 and 1994); and the World Bank WDR and other sources. Our main sample of 123 nations comprised all the countries for which the UNDP reports economic growth rates and life expectancies at two different periods. The countries of the ex-USSR are not being included for reasons of data limitations, while other 'real socialist' or ex-'real socialist' nations, like China and Hungary, at any rate integral parts of the conceptualizations of the capitalist world economy today, do form part of our investigation.
Our leading, but not exclusive indicator of the process of dependence and globalization is the UNCTAD version for the old MNC (multinational corporation) penetration indicator of a country in the present Kondratieff-cycle. The MNC-penetration-concept was first contained in the very widely used publication by Bornschier and Heintz, reworked and enlarged by Ballmer-Cao and Scheidegger, later on widely popularized by the book publication Bornschier/Chase Dunn, 1985, and used throughout the world in quantitative research. Their emphasis then was on MNC investments, 1967 and 1973, weighted by population and total capital stock. The UNCTAD MNC penetration indicator based on the concept of the share of FDI stock is defined in terms of total host-country GDP.
The more dependent a country is in the system of the world-wide market economy, the greater will be the penetration of its economy by transnational capital. Dependency theories (Cardoso/Faletto, 1971) hold, that the countries of the periphery were integrated into the world-economy in the following sequence of events
(i) desarrollo hacia exterior (development to the outside)
(ii) desarrollo hacia adentro (inward-looking development)
(iii) transnacionalizacion de los mercados internos (internationalization of the internal markets)
Starting from the late 1950s, the transnational system increasingly dominates the industrialization process of the periphery and the semi-periphery (phase iii). The penetration of the host countries by transnational investment becomes the most important scientific yardstick of dependency (Bornschier/Chase-Dunn, 1985).
To these phases in the evolution of the international division of labor, one would have to add
(iv) financial capitalism and globalization
as the latest stage of center-periphery relationships during the 1980s and 1990s.
Cycle time plays an important role in our approach. Above, we already hinted at Arrighi’s thought, that the logic of accumulation on a world scale shifts along time, and that we again witness during the 1980s and beyond a deregulated phase of world capitalism with a logic, characterized - in contrast to earlier regulatory cycles - by the dominance of financial capital. Arrighi further teaches us that even a century can be a ‘short run’ in the evolution of world capitalism. There are signal crises of world capitalism, and there are terminal crises of the world system, like the great crash of the early 1340s, which marked the beginning of the Genoese age, the 1560s, which marked the beginning of the Dutch era, the 1750s and 1760s, which marked the beginning of the British era, and the 1930s, which were the terminal crisis of British world capitalist dominance. Regulation can be successful, like after 1560, and 1930, and deregulation can be successful, like after 1340, 1760, and - most probably - the 1980s (compiled from Arrighi, 1995). Macroquantitative research about the determinants of world development has to be conscious about the time horizon, in which the research design is situated. Bornschier (1988) found out that state sector expenditures in 21 western democracies correlate with economic growth in the following fashion:
|
1950-60r = + .41 |
|
|
1960-75 |
r = - .07 |
|
1974-77 |
r = - .72 |
(Bornschier, 1988: 309)
For the period 1980-93, the correlation was:
|
1980-93 |
r = -.02 |
(our own calculation from UNDP, HDR, 1997 (growth rate of GNP); World Resources Institute (state sector size, around 1980); cross-checked with Fischer Weltalmanach, 1998 (state sector). In the world of transformation (nine countries with complete data on state sector size (UNDP, 1997) and economic growth (Economist, The World in 1998; Fischer Weltalmanach, 1998), the best fit between central state sector size and growth was y = 0,0034x3 - 0,3334x2 + 10,388x - 99,014; R2 = 0.3227)
Thus, the growth efficiency of public expenditures has drastically declined over the 1970s, to be indecisive today. If the post-war period was regulatory, the post-1968 period was decidedly anti-regulatory, to achieve a level of non-determination today (Arrighi, 1995; Bornschier, 1988). Studies about world development throughout the entire period 1960 - 1998 might be misleading, because the time period would reflect the ‘logic’ of the waning ‘regulatory’ cycle, the economic global crisis of the 1970s and the early 1980s, and the ascent of financial capitalism and the East Asian archipelago of the early 1990s, which today might have reached its first limits. Thus, the beginning of the 1980s serve as our ‘cutting point’.
The long cycle literature, largely overlooked by macroquantitative development studies, tells us, why there is a recurrent pattern of instability in the social orders both at the level of national society as well as at the level of the international system. It also explains the often puzzling aspect, how different studies, using different time perspectives, reach different results. Long cycles, to be explained by at least 13 different types of theories, by themselves are quite a strong argument in the debate about the long-run viability of the world-wide market economy: the recurrence of cycles, depressions and wars was thematically portrayed, amongst others, by Scandella (1998), Goldstein (1988), Bornschier and Suter (1992), Bornschier (1988, expanded and updated English version 1996) and Arrighi (1995).
The intense controversy about cycles should only be mentioned briefly here; for the policy-maker perhaps more important is the fact, that after the economic crisis of 1825, the stock exchange collapse of 1873, the Black Friday of 1929 and the world recession starting in 1973/75, world capitalism has experienced quite severe downswing-phases, that hit with elementary weight especially the countries of the periphery and the semi-periphery. The Kondratieff cycles of approximately 40-60 years duration and the Kuznets cycles, 18-22 years long, are especially relevant for our understanding of the ups and downs of world economics and politics: our data series, constructed from Goldstein’s original data, is explained quite markedly by the application of the Kondratieff and Kuznets-cycle hypotheses, even when there are no data filtering or smoothening operations being performed. And thus, we have to disagree in one fundamental aspect with Chase-Dunn and Grimes, 1995: Kondratieffs exist, especially when you filter out the very short-term Kitchin cycle. And add to this the lagged movement of world prices and interest rates, which are part and parcel of the cycle structure (Scandella, 1998). Among the main theories, that explain these Kondratieff cycles, the following schools stand out (Bornschier and Suter, 1992):
For Bornschier’s sociology of the long cycle, there are the following phases
(i) upswing
The question is not to choose between Kondratieff and Kuznets cycles. The research strategy should integrate these two concepts by properly applying more long-term moving averages that filter the shorter-term fluctuations. Our starting point are the two well-known data series on industrial production growth in the world economy 1740-1975 by J. Goldstein (1988):
Let Xtn+1 be the index value of world production for tn+1; Xtn index value of world production for tn
|
Xtn+1 |
||||
|
(3.1.1) DYN |
= |
–––––––– |
- |
1 |
|
Xtn |
Post-1975 data on OECD country economic growth: UN ECE; Fischer Weltalmanach, see Tausch, 1994. X is the time axis. Pre-1975 data are world industrial product growth estimates.
The approximately 20-year Kuznets cycles, that emerge from Goldstein’s data, can be neatly shown by 6th-order polynomial regression estimates, based on the above described data series (see above). Now we update the evidence, that led Goldstein to the conclusion that the capitalist world systems tends continuously towards wars and violent conflicts. The international system is characterized according to him by
global war à world hegemony of the dominant power à de-legitimization of the international order à de-concentration of the global system à global war et cetera
The duration of these phases of the international order is approximately one Kondratieff cycle, so the unit of time of the international system can be symbolized by the expression 1K.
Graph 3.1: the tendencies of the capitalist world economy towards Kondratieff cycles
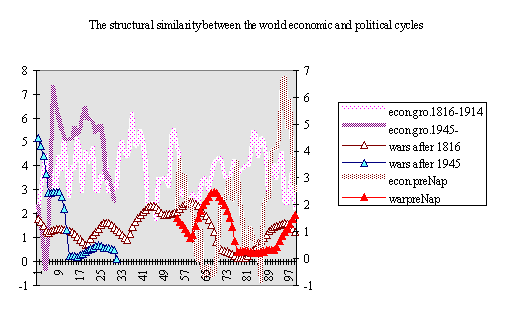
economic growth (left hand scale) and war intensity (right-hand scale) in the world economy. Moving 9-year averages, calculated with EXCEL 5.0 from Goldstein’s original data.
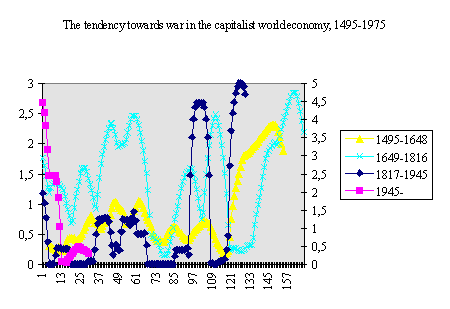
war intensity = Nat. logarithm from (1 + battle fatalities from great-power wars ^0.10)
At a time of major shifts in world politics and economics, it is no wonder that systematic studies in the evolution of the international order have gained ground. Arrighi’s main hypotheses (1995) differ from those of Goldstein. Goldstein’s quantitative approach (1988 ff.) concentrates on the major power confrontations as the ‘watershed’ in international relations. Ample empirical evidence supports both Arrighi’s and Goldstein’s theories. The recurrence of major power wars in the capitalist world economy from 1495 to the present is one of the most intriguing features of the international system. Each world political cycle up to now corresponded to a ‘W’-pattern of untransformed annual battle fatalities from major power wars in thousands. The war cycle 1495-1648 is a polynomial expression of the 6th order; R^2 is 91.7%; 1649-1816 yields an R^2 of 33.6%; while a polynomial expression of the 6th order explains 50.1% of war intensity 1817-1945. The x-axis in our graph is the number of years after the end of the major power wars, i.e. 1648, 1816, and 1945. The same, deadly function explains 49.5% of annual battle fatalities in thousands from 1946 to 1975.
The starting point to our analysis of Kondratieff cycles is Goldstein’s untransformed data series about economic growth since 1740. Since 1975, we used UN ECE Economic Survey of Europe, IFRI data (world GDP growth) and IMF World Economic Outlook data (for OECD country growth as a proxy for world development):
Graph 3.2: Kondratieff cycles, based on 9 year moving averages
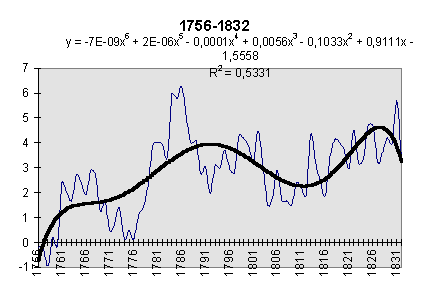
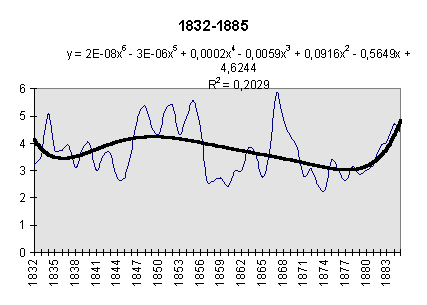
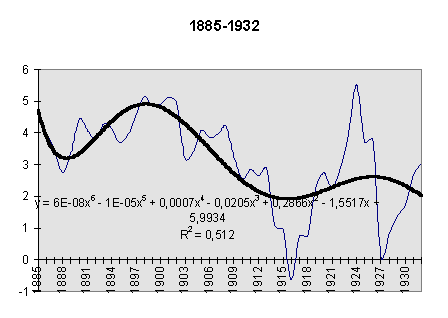
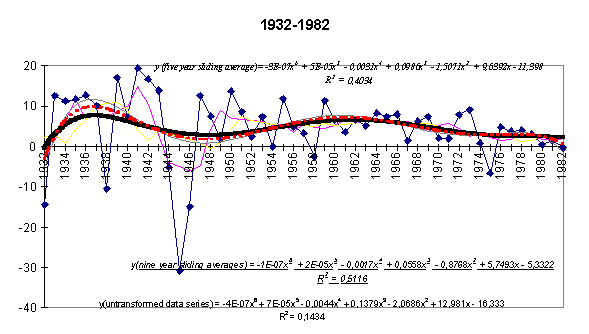
Legend: economic growth rates in the world system, as being estimated from Goldstein’s data series
If we let the postwar-cycle end with 1975, the functions have the following shape:
1932 - 1975
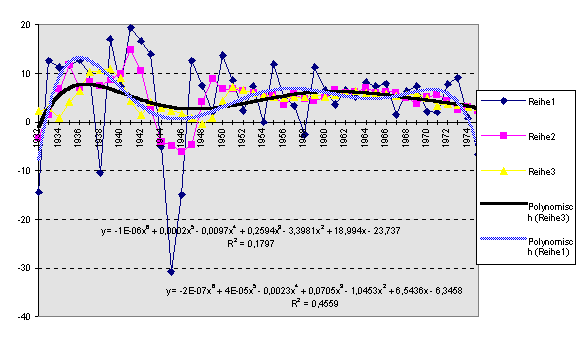
Legend: data about the severity of the depression in 1975 differ according to the data source used.
The stylized Kondratieff-function could have the following form:
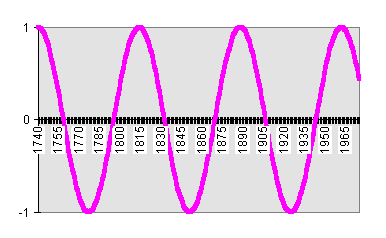
Source: our own compilations, using a cosine function (1740 = 0; 1741 = 0,85; 1742 = 0,85 + 0,85 etc.). Economic growth in the world system since 1740; adapted from Goldstein, 1988 and UN ECE/Fischer Weltalmanach, current issues. 5 and 10-year moving averages and the trend lines for these two data series
In his new overview of Kondratieff cycle theories, Luigi Scandella re-interprets economic theories, like the Phillips curve and the Fisher equation, in the light of the long-cycle literature and arrives at the conclusion, that price levels and interest rates fluctuate as well in the above described way, with a time-lag of 5 to 10 years between production and price levels and again between price levels and interest rates. Thus the way is open for important further empirical research, since historic price level data are far more complete than historic production data.
Throughout this work, the following statements hold:
Regression coefficients at the level of error probability < or = 5% are printed in bold type. The following further conditions do hold:
Concepts: growth always refers to per capita income growth in real terms, if not specified otherwise
Time period: 1980s and beyond (if not specified otherwise)
Missing values: mean substitution, if possible, by known values for the economic or geographic region (like: countries with low human development, excluding India et cetera)
It should be explained here, what is meant under the term 'structural adjustment': the empirical measurement (and not normative concept) of adjustment compares the GNP per capita growth rates in two subsequent periods with a regression-based residual analysis. In other words: we try to answer the empirical, and not normative question, which countries accelerated economic growth compared to the earlier cycle, and which countries adapted badly to the new conditions. Our measurement concept compares growth rates predicted for the period of the new Kondratieff cycle (post 1980/82)(^Yi) upon knowledge of the performance during the earlier Kondratieff B-phase (1965-80) with the actual growth rates Yi during the new Kondratieff cycle from 1980/82 onwards:
|
(3.2a) adjustment i = Yitn- |
^Yitn |
|
Y = economic growth |
|
|
Ytn = a + b1 * Ytn-1 |
Changes in the underlying logic of ascent and decline in the world economy will be especially observable at a time of comparison between the logic of a waning Kondratieff cycle and the emerging laws of a new cycle. Thus, adjustment will be a theoretically especially relevant phenomenon.
Next, we should deal with the trade-off between development level and performance. Policy planning must, in order to avoid spurious results, under any circumstances properly specify such trade-offs. Poor countries increase rapidly their average life-expectancy or economic growth and they quickly reduce their income inequality; prima vista there will be a spurious and very high, but absolute non-sense correlation between, say, the number of shanty-town dwellers per total population and life expectancy increases. The reduction of the infant mortality rate, the acceleration of growth or the redistribution of income over time will all dramatically and positively be influenced by the number of people still living in shanty towns. If we do not properly specify development level as an intervening variable, our results will be biased extremely.
The curve-linear function of growth, being regressed on the natural logarithm of development level and its square, is sometimes called the 'Matthew's effect' following Matthew's (13, 12):
'For whosoever hath, to him shall be given, and he shall have more abundance: but whosoever hath not, for him shall be taken away even that he hath'
Social scientists interpreted this effect mainly in view of an acceleration of economic growth in middle-income countries vis-à-vis the poor countries and in view of the still widening gap between the poorest periphery nations ('have-nots') and the 'haves' among the former Second and Third World (Jackman, 1982):
(3.2b) economic growth/adjustment success = a1 + b1* ln (PCItn-1)-b2* (ln(PCItn-1))2
The same function is also applied to income inequality, following a famous essay published by S. Kuznets in 1955. Redistribution gets underway after 1000 $ per capita income is reached; the share of the richest 20% diminishes from approximately 55% to around 40%. Growth and adjustment accelerate with redistribution. In general terms, we explain development performance by the following standard multiple cross-national development research equations:
(3.2c) development performance 1980-mid 1990s = a1 + b1*first part curvilinear function of development level by around 1980 - b2*second part curvilinear function of development level by around 1980 - b3...*MNC penetration (UNCTAD) and other dependency indicators mid 1980s - b4...*state sector influence indicatorsmid 1980s + b5...*social reform indicators mid 1980s - b6...* distribution coalition prone environment indicatorsmid 1980s + b7...*political feminism indicators mid 1980s
In each of the 19 equations, MNC penetration forms part and parcel of the predictor variables. In addition, our growth equation (GNP per capita income growth in real terms) starts from the following predictors:
(3.2d) growth = a1 + b1* ln (PCItn-1) - b2* (ln(PCItn-1))2 - b3*MNC penetration (UNCTAD) mid 1980s + b4*social security expenditures per GDPmid 1980s - b5*fertility rate mid 1980s - b6* UN membership years + b7*%women in parliament mid 1980s + b8*female share of the labor force mid 1980s - b9*trade dependency mid 1980s - b10*military personnel rate mid 1980s - b11*state sector expenditures mid 1980s
Reformists would hold that social security expenditures, women in parliament, and female employment, together with low fertility rates, are indicators of social reform, while liberals would clearly interpret UN membership years as enhancing the existence of distribution coalitions, while military personnel and state sector expenditures are to be interpreted as indicators of a strong state sector influence. In our equations, adjustment, ethno-warfare, gender development, gender empowerment, growth, human development, human rights violations, labor force participation, mean years of education, political rights violations, and the UNDP-CPM-poverty measure are all explained by an equation, analogue to 3.2d. For the equations determining forest coverage, deforestation rates, and the destabilization/war indicator we had to add ‘% of land area used by agriculture’ as an additional control variable in order to take abundance or scarcity of agricultural land and its influences on development into account.
Now, we should turn to basic human needs satisfaction and hence, life expectancy: it is very difficult to arrive at valid propositions about social conditions and development as a dependent variable on the basis of income distribution data alone. There are comparable World Bank income distribution data for only 65 countries, while basic human needs satisfaction data are available from many more countries. Studies about the determinants of basic human needs satisfaction, and hence, poverty are of a more recent date (Stokes and Andreson, 1990; Tausch and Prager, 1993; furthermore: Moon and Dixon, 1992; Ragin and Bradshaw, 1992, just to mention a few). The idea to link life expectancy to energy consumption levels or dollar income levels, that is to say, to patterns of civilization, that exploit mother earth and lead to the self-destruction of life chances of the human species, is still somewhat revolutionary, although there has been quite an extensive debate among different researchers from the ILO, the World Bank and other researcher institutions, most notably Goldstein, 1985b and Russett, 1983b, on the proper specification of the development-basic-human-needs trade-off. Among the decision makers of our time, US vice-president Gore formulated such ‘green’ philosophical apprehensions in the most stringent fashion (Gore, 1994). It is difficult to design a single indicator of the civilisational malaise constituted by the environmental crisis caused by the industrial mode of production. But the energy consumption-life expectancy trade-off offers a very clear, mathematical expression. The prime success measure of a society should be, how much energy can be saved in achieving a given quantity of life of the population and to avoid premature death. The limited resources of our planet, so clearly foreseen by Polanyi, dictate, that as little as possible energy is being used. The social demands and moral convictions of civilizations dictate, that premature death should be avoided. Thus, eco-social reasoning taking into account the performance scores of the energy consumption-life expectancy trade-off would hold, that the energy consumption of a society should be minimized and life expectancy maximized. One formulation of this position, reported in Tausch and Prager, 1993, that contains a reference to the extensive earlier debate at the World Bank and at the ILO, arrived at the conclusion that using very common deviates of the natural constants e (2.7) and p (3.14159...) reproduce this important trade-off in an optimal fashion, although most other published mathematical formulations boil down to similar strong curve-linear functions. It is also imperative to consider the effect of already achieved levels of life expectancy on the subsequent life expectancy increase: a poor society with, say, 40 years life expectancy will find it easier to expand the well-being of the population to 50 years average life expectancy than a society that already reached the level of a 75 year-average.
To avoid problems of collinearity, increases in life expectancy over time are being calculated by differences in logarithms 10, i.e.
(3.3) DYN LEX = ((log 10 (LEX tn)-log 10 (LEX tn-1)) * 100
Let LEX denote life expectancy or other basic human needs indicators, PCI per capita incomes, ENCONS p.c. energy consumption rates per capita and year in kg oil equivalent, and DYN rates of increases of basic human needs satisfaction. On a world scale and for different groups of countries, levels of human development and increases in terms of human development, reductions in infant mortality et cetera will always significantly correspond to the following function and the first derivative:
(3.4) LEX = a + b1 * (ENCONS p.c.)^(1/(e^2)) - b2 * (ENCONS p.c.)^ln(p)
R2 = 72.4%; F = 157.63; df. = 120; a (one-tailed) 5% > 1.289
(3.5) DYN LEX(tn) = a - b1 * LEX (tn-1) +-
b2 * (PCI)(tn-1)^((1/(e^2))-1)-b3 * (PCI)(tn-1)^(((ln(p))-1)))
R2 = 69.8%; F = 91.85; df. = 120; a (one-tailed) 5% > 1.289
predictors b2 and b3 only: R2 = 43.3%; F = 45.89; df. = 120; a (one-tailed) 5% > 1.289. Formulation also possible with ENCONS p.c., but the PCI data series is more complete
Based on UNDP (1993) data for all the countries that report economic growth rates for the periods 1965-80-90, equation (3.4) explains 72.4% of total variance of life expectancy; equation (3.5) - even without life expectancy in 1960 as an additional control variable - explains 45.9% of total variance.
Equation (3.2) can also be applied to human development, the world gender issues and democratization:
(3.6a) human development or gender development or gender empowerment = a1 - b1* ln (PCItn-1) + b2* (ln(PCItn-1))2
or
(3.6b) political rights violations or civil rights violations = a1 + b1* ln (PCItn) - b2* (ln(PCItn))2
Human development, and the growing participation of women in society, are a clearly rising function of achieved development level, while political and civil rights violations decrease along the course of development. No result is weaker than roughly 2/5 of variance explained; and all results show - per se - an optimistic perspective for human development, gender justice and democratization: the human development index, the gender development index, the gender empowerment index (ranging from 0.0 to 0.999 each), political rights violations and civil rights violations (ranging from 1.0 to 7.0) are all to be represented as a function of achieved development level in 1990 (expressed in purchasing power parity rate). For the calculation of the gender empowerment (GEI) function, the following procedure to estimate missing data was followed: means of country groups with available data were taken to substitute missing values. The following groups were used: industrial countries (UNDP definition, 1993; GEI = 0.56); developing countries with a higher human development index (UNDP 1993 list - Barbados through to Saint Lucia; GEI = 0.391); developing countries with medium human development (UNDP 1993 list - Turkey through to El Salvador; GEI = 0.347); developing countries with low human development (UNDP 1993 list - Maldives through to Sierra Leone; GEI = 0.27). The following statistical properties of the functions hold:
|
human development index |
R^2 = 82.4%; F = 281.0 |
|
gender development index |
R^2 = 80.1%; F = 240.8 |
|
gender empowerment index |
R^2 = 60.0%; F = 90.0 |
|
political rights violations |
R^2 = 38.0%; F = 36.8 |
|
civil rights violation |
R^2 = 40.0%; F = 39.9 |
(3.6a) might be formulated, however, by function (3.6b), applying model (3.4). The function is:
(3.6b) Human Development Index = a + b1 * (real purchasing power p.c.)^(1/(e^2)) - b2 * (real purchasing power p.c.)^ln(p)
The income inequality equation starts out from the well known Kuznets-curve, and uses militarization and fertility as additional control variables.
4) TNC dependence is causing long-term stagnation
Following equation 3.2c and 3.2d we now establish for 19 development indicators, that TNC-dominated development pressures societies towards higher income inequality, and less development. Women, especially, become marginalized, a trend, which is still enhanced by the growing tendency towards a new international division of labor. In Europe, where the legacy of politically established feminism is still relatively strong, state expenditures are being used to redress the balance, but the struggle is an uphill one against the tendencies of contemporary globalization. Feminism will become over the years the big loser in the redistribution of world political and economic resources.
High MNC penetration becomes one of the main blocks against further long-term ascent in the world economy, spurts of short-term growth notwithstanding (see also Chapter 2). We have already stated, that for a true liberal economist, dependency is a special situation of the typical constraints, caused by a policy of import substitution and export discrimination. Policies, that create double deficits (huge current account balance deficit + large state sector budget deficits) and discriminate against internal savings, will lead to a high propensity to import foreign capital.
Neo-classical and of course dependencia theorists would admit, that gender discrimination is a typical violation of the assumptions of a functioning market economy. The neo-classical remedy would consist in creating better market access for the underprivileged groups. Without question, the gender issue is one of the most typical instances of such a market imperfection under ‘capitalism’. The solution, especially in Europe, has been to remedy this imperfection with huge programs of state expenditures. But state expenditures in excess of revenues, together with a deficit in the balance on the current account, are a good receipt for increasing the share of foreign capital in the national economy. The circle continues.
Government consumption in the EU was 19% already in 1992, and will still increase with the eastward expansion of the Union and the rising unemployment problem. Tax revenue was on average only 38% of GNP - in contrast to the 50.9% of GNP, spent by the national government. EU-imports were 23% of GNP, while EU-exports only 22% of EU-GNP. By 1992, the average deficit per EU-GNP was 10%. In such a situation, the inflow of foreign capital, including that of dubious legality, will become an economic necessity. Indirect taxes play an overwhelming role in European finances, and indirect taxes are a growth-inhibiting structure of their own (Tausch/Prager, 1993). By the beginnings of the 1990s, the penetration of MNC in the European Union economies in terms of total manufacturing employment was quite considerable.
The cross-national results about the effects of globalization
In our empirical analysis, as we already explained in our methodological section above, we included the proper specifications for development levels and other trade-offs affecting processes of development. For example, it would be senseless to predict life expectancy increases without properly taking into account earlier, achieved levels of life expectancy; and it would be senseless to talk about deforestation rates and coverage of a country with woodlands, not knowing how much of the total area is taken up by agricultural land. Dependency from the transnational corporations both in 1973 and in 1985 significantly and fairly constantly blocks development. The data outprints of Table 4.1 reiterate again the well-known dependency and neo-classical results in the tradition of Bornschier, Chase-Dunn, Dadush and Brahmbatt, even for the new time period and the new indicators of world development, published by the UNDP. To judge from Table 4.1, the world after 1980 seems to be a neat repetition of the well-known scholarly Weltbild, that emerged from the writings of Volker Bornschier and Chris Chase-Dunn during the 1980s, and to which we referred to above. Our findings suggest, that MNC penetration in the present Kondratieff cycle period again significantly blocks adjustment, growth, increases of life expectancy, the political and human rights record, the human development index, and the gender development index, the gender empowerment index, the life expectancy, a reduction of maternal mortality, and the protection of the world forests.
In addition, income inequality (the share of top 20% of income earners in 81 countries according to Moaddel’s data base, enlarged by WDR World Bank data, 1994) is also well explained by the penetration of multinational corporations in the host countries, and is - in contrast to Weede’s earlier findings - nowadays significantly enhanced and not lessened by militarization. Almost as a footnote to these arguments, one can add, that terms of trade have a significant effect in the expected direction on the process of maternal mortality:
Table 4.1: The effects of dependency (FDI stock per total GDP in the host countries) and world development - data for the 1980s and beyond
|
MNCP85 |
Govex |
Trade Dep |
social sec |
UN-membery |
Women Parl |
Women %LF |
ln PCI |
ln PCI^2 |
ln(MPR+1) |
Fertility Rate |
Constant |
|||||||||||||
|
adjustment |
-0,758 |
-0,717 |
0,1956 |
-4,491 |
0,0169 |
-0,05 |
-0,045 |
0,1354 |
0,0044 |
-0,042 |
0,0092 |
27,36 |
||||||||||||
|
65/80/93 |
0,1563 |
0,7946 |
0,2894 |
4,3203 |
0,0211 |
0,0329 |
0,0181 |
0,0512 |
0,0064 |
0,0188 |
0,014 |
16,516 |
||||||||||||
|
0,3777 |
2,2049 |
|||||||||||||||||||||||
|
6,1235 |
111 |
|||||||||||||||||||||||
|
327,46 |
539,62 |
|||||||||||||||||||||||
|
t-Test |
-4,847 |
-0,902 |
0,6757 |
-1,039 |
0,8025 |
-1,53 |
-2,483 |
2,643 |
0,6865 |
-2,228 |
0,661 |
|||||||||||||
|
MNC PEN85 |
Govex |
Trade Dep |
social sec |
UN-membery |
Women Parl |
Women %LF |
ln PCI |
ln PCI^2 |
ln(MPR+1) |
Fertility Rate |
Constant |
|||||||||||||
|
growth |
-0,907 |
-0,281 |
0,0954 |
-3,147 |
0,0144 |
-0,063 |
-0,038 |
0,1416 |
0,0086 |
-0,04 |
0,0145 |
23,795 |
||||||||||||
|
1980-93 |
0,1551 |
0,7885 |
0,2872 |
4,2869 |
0,0209 |
0,0327 |
0,0179 |
0,0508 |
0,0063 |
0,0187 |
0,0138 |
16,389 |
||||||||||||
|
0,4425 |
2,1879 |
|||||||||||||||||||||||
|
8,0108 |
111 |
|||||||||||||||||||||||
|
421,8 |
531,33 |
|||||||||||||||||||||||
|
t-Test |
-5,846 |
-0,356 |
0,3322 |
-0,734 |
0,6895 |
-1,922 |
-2,104 |
2,7849 |
1,3644 |
-2,116 |
1,0498 |
|||||||||||||
|
LEX 1960 |
1 der e-funct |
1 der p-func |
MNCP85 |
Viol Civ Rits |
Trade Dep |
Terms Trade |
UN-membery |
Women Parl |
Women %LF |
ln(MPR+1) |
Constant |
|||||||||||||
|
DYN |
1,3468 |
-0,05 |
-0,033 |
-0,028 |
0,0147 |
-0,006 |
0,0599 |
0,0348 |
-0,497 |
-25,58 |
-0,292 |
27,108 |
||||||||||||
|
LEX |
0,7823 |
0,0201 |
0,03 |
0,0179 |
0,0157 |
0,0062 |
0,171 |
0,0137 |
0,7032 |
6,6478 |
0,0353 |
2,5246 |
||||||||||||
|
0,7565 |
2,1702 |
|||||||||||||||||||||||
|
31,349 |
111 |
|||||||||||||||||||||||
|
1624,1 |
522,79 |
|||||||||||||||||||||||
|
t-Test |
1,7215 |
-2,509 |
-1,115 |
-1,578 |
0,9382 |
-0,903 |
0,3502 |
2,528 |
-0,707 |
-3,847 |
-8,265 |
|||||||||||||
|
e-func Encon |
p -func Enc |
MNCP85 |
Viol Civ Rits |
Trade Dep |
Terms Trade |
pub invest |
Women Parl |
Women %LF |
ln(MPR+1) |
Fertility Rate |
Constant |
|||||||||||||
|
green |
0,0107 |
0,0514 |
0,0016 |
-0,002 |
-0,003 |
-3E-04 |
0,0001 |
0,0116 |
-0,001 |
2E-05 |
0,0249 |
0,0823 |
||||||||||||
|
house |
0,0152 |
0,0681 |
0,0018 |
0,0025 |
0,0013 |
0,0013 |
0,0005 |
0,0129 |
0,0011 |
4E-06 |
0,0798 |
0,2998 |
||||||||||||
|
index |
0,4238 |
0,1787 |
||||||||||||||||||||||
|
7,4227 |
111 |
|||||||||||||||||||||||
|
2,606 |
3,5427 |
|||||||||||||||||||||||
|
t-Test |
0,7035 |
0,7549 |
0,882 |
-0,742 |
-2,351 |
-0,26 |
0,254 |
0,901 |
-0,901 |
4,328 |
0,3121 |
|||||||||||||
|
pol rights |
MNCP85 |
Govex |
Trade Dep |
social sec |
UN-membery |
Women Parl |
Women %LF |
ln PCI |
ln PCI^2 |
ln(MPR+1) |
Fertility Rate |
Constant |
||||||||||||
|
violations |
0,5633 |
1,3303 |
0,0892 |
-1,74 |
0,0046 |
0,0561 |
0,0209 |
-0,11 |
0,0057 |
0,0133 |
0,0032 |
6,9943 |
||||||||||||
|
0,1083 |
0,5504 |
0,2005 |
2,9926 |
0,0146 |
0,0228 |
0,0125 |
0,0355 |
0,0044 |
0,013 |
0,0097 |
11,441 |
|||||||||||||
|
0,568 |
1,5273 |
|||||||||||||||||||||||
|
13,266 |
111 |
|||||||||||||||||||||||
|
340,4 |
258,92 |
|||||||||||||||||||||||
|
t-Test |
5,2024 |
2,4168 |
0,4451 |
-0,582 |
0,3158 |
2,4594 |
1,6653 |
-3,098 |
1,2994 |
1,0218 |
0,3327 |
|||||||||||||
|
MNCP85 |
Govex |
Trade Dep |
social sec |
UN-membery |
Women Parl |
Women %LF |
ln PCI |
ln PCI^2 |
ln(MPR+1) |
Fertility Rate |
Constant |
|||||||||||||
|
civil rights |
0,3549 |
1,4809 |
0,0051 |
-0,535 |
-0,002 |
0,0361 |
0,0275 |
-0,098 |
0,002 |
-0,008 |
0,0014 |
4,4396 |
||||||||||||
|
violations |
0,084 |
0,4268 |
0,1554 |
2,3205 |
0,0113 |
0,0177 |
0,0097 |
0,0275 |
0,0034 |
0,0101 |
0,0075 |
8,871 |
||||||||||||
|
0,601 |
1,1843 |
|||||||||||||||||||||||
|
15,203 |
111 |
|||||||||||||||||||||||
|
234,53 |
155,67 |
|||||||||||||||||||||||
|
4,2269 |
3,4698 |
0,0328 |
-0,231 |
-0,21 |
2,0412 |
2,8337 |
-3,566 |
0,5888 |
-0,748 |
0,184 |
||||||||||||||
|
Human Development Index |
MNCP85 |
Govex |
Trade Dep |
social sec |
UN-membery |
Women Parl |
Women %LF |
ln PCI |
ln PCI^2 |
ln(MPR+1) |
Fertility Rate |
Constant |
||||||||||||
|
-0,095 |
0,1544 |
0,0047 |
0,0402 |
-1E-04 |
-0,003 |
-4E-04 |
0,0009 |
-2E-04 |
0,0006 |
0,0005 |
0,4008 |
|||||||||||||
|
0,0079 |
0,04 |
0,0146 |
0,2177 |
0,0011 |
0,0017 |
0,0009 |
0,0026 |
0,0003 |
0,0009 |
0,0007 |
0,8321 |
|||||||||||||
|
0,8695 |
0,1111 |
|||||||||||||||||||||||
|
67,224 |
111 |
|||||||||||||||||||||||
|
9,125 |
1,3697 |
|||||||||||||||||||||||
|
-12,08 |
3,8562 |
0,3237 |
0,1845 |
-0,106 |
-1,589 |
-0,426 |
0,3348 |
-0,716 |
0,663 |
0,6949 |
||||||||||||||
|
MNCP85 |
Govex |
Trade Dep |
social sec |
UN-membery |
Women Parl |
Women %LF |
ln PCI |
ln PCI^2 |
ln(MPR+1) |
Fertility Rate |
Constant |
|||||||||||||
|
-0,071 |
0,0814 |
-0,008 |
0,1812 |
0,0009 |
-0,002 |
-2E-04 |
0,0022 |
-2E-04 |
0,0004 |
0,0007 |
-0,072 |
|||||||||||||
|
0,0058 |
0,0294 |
0,0107 |
0,1597 |
0,0008 |
0,0012 |
0,0007 |
0,0019 |
0,0002 |
0,0007 |
0,0005 |
0,6107 |
|||||||||||||
|
0,8705 |
0,0815 |
|||||||||||||||||||||||
|
67,801 |
111 |
|||||||||||||||||||||||
|
4,9568 |
0,7377 |
|||||||||||||||||||||||
|
Gender Development Index |
||||||||||||||||||||||||
|
-12,36 |
2,7703 |
-0,706 |
1,1346 |
1,1746 |
-1,809 |
-0,23 |
1,1382 |
-0,707 |
0,5363 |
1,285 |
||||||||||||||
|
MNCP85 |
Govex |
Trade Dep |
social sec |
UN-membery |
Women Parl |
Women %LF |
ln PCI |
ln PCI^2 |
ln(MPR+1) |
Fertility Rate |
Constant |
|||||||||||||
|
-0,021 |
0,0038 |
0,015 |
-0,177 |
0,0014 |
0,0055 |
0,0007 |
0,0023 |
-1E-04 |
5E-05 |
0,0006 |
0,8051 |
|||||||||||||
|
0,0041 |
0,0208 |
0,0076 |
0,1129 |
0,0006 |
0,0009 |
0,0005 |
0,0013 |
0,0002 |
0,0005 |
0,0004 |
0,4317 |
|||||||||||||
|
0,8216 |
0,0576 |
|||||||||||||||||||||||
|
46,465 |
111 |
|||||||||||||||||||||||
|
1,6974 |
0,3686 |
|||||||||||||||||||||||
|
Gender Empowerment Index |
||||||||||||||||||||||||
|
MNCP85 |
Govex |
Trade Dep |
social sec |
UN-membery |
Women Parl |
Women %LF |
ln PCI |
ln PCI^2 |
ln(MPR+1) |
Fertility Rate |
||||||||||||||
|
-5,089 |
0,1813 |
1,9835 |
-1,57 |
2,5954 |
6,364 |
1,537 |
1,7252 |
-0,895 |
0,1112 |
1,644 |
||||||||||||||
|
e-func Encon |
p -func Enc |
MNCP85 |
Viol Civ Rits |
Trade Dep |
Terms Trade |
Constant |
Life Expectancy |
|||||||||||||||||
|
0,0387 |
0,0082 |
-1,41 |
0,0046 |
-4E-04 |
17,262 |
25,561 |
||||||||||||||||||
|
0,0356 |
0,0138 |
0,3021 |
0,0303 |
1E-04 |
1,58 |
5,1809 |
||||||||||||||||||
|
0,7737 |
5,009 |
|||||||||||||||||||||||
|
66,116 |
116 |
|||||||||||||||||||||||
|
9953,2 |
2910,5 |
|||||||||||||||||||||||
|
1,0862 |
0,5931 |
-4,668 |
0,1524 |
-3,766 |
10,925 |
|||||||||||||||||||
|
Life expectancy |
||||||||||||||||||||||||
|
e-func Encon |
p -func Enc |
MNCP85 |
Viol Civ Rits |
Trade Dep |
Terms Trade |
Constant |
Maternal Mortality |
|||||||||||||||||
|
-1,564 |
-0,247 |
22,606 |
-0,05 |
0,0129 |
-551,3 |
1655,5 |
||||||||||||||||||
|
1,158 |
0,4491 |
9,8139 |
0,9842 |
0,0032 |
51,33 |
168,31 |
||||||||||||||||||
|
0,7231 |
162,73 |
|||||||||||||||||||||||
|
50,487 |
116 |
|||||||||||||||||||||||
|
8E+06 |
3E+06 |
|||||||||||||||||||||||
|
e-func Encon |
p -func Enc |
MNCP85 |
Viol Civ Rits |
Trade Dep |
Terms Trade |
|||||||||||||||||||
|
-1,351 |
-0,55 |
2,3034 |
-0,051 |
4,0413 |
-10,74 |
|||||||||||||||||||
|
MNCP85 |
Govex |
Trade Dep |
social sec |
UN-membery |
Women Parl |
Women %LF |
ln PCI |
ln PCI^2 |
ln(MPR+1) |
Fertility Rate |
%agland |
Constant |
|
|
%forest |
-0,451 |
-2,685 |
-11,86 |
-2,419 |
34,205 |
0,5247 |
0,6685 |
-0,072 |
-0,385 |
-0,06 |
0,1344 |
-0,193 |
-85,86 |
|
area |
0,1307 |
1,4212 |
7,0959 |
2,5719 |
38,418 |
0,1874 |
0,2954 |
0,1607 |
0,4696 |
0,0565 |
0,1678 |
0,127 |
147,29 |
|
0,3029 |
19,589 |
||||||||||||
|
3,9827 |
110 |
||||||||||||
|
18339 |
42211 |
||||||||||||
|
t-Test |
-3,447 |
-1,889 |
-1,672 |
-0,941 |
0,8903 |
2,7998 |
2,2632 |
-0,447 |
-0,819 |
-1,057 |
0,8006 |
-1,521 |
|
|
MNCP85 |
Govex |
Trade Dep |
social sec |
UN-membery |
Women Parl |
Women %LF |
ln PCI |
ln PCI^2 |
ln(MPR+1) |
Fertility Rate |
%agland |
Constant |
|
|
annual |
0,0127 |
0,0805 |
-0,653 |
-0,223 |
3,2788 |
0,0047 |
-0,002 |
0,0077 |
-0,058 |
0,0049 |
-0,001 |
-0,007 |
-11,43 |
|
deforest |
0,0064 |
0,0696 |
0,3473 |
0,1259 |
1,8803 |
0,0092 |
0,0145 |
0,0079 |
0,023 |
0,0028 |
0,0082 |
0,0062 |
7,2093 |
|
0,3446 |
0,9588 |
||||||||||||
|
4,8196 |
110 |
||||||||||||
|
53,166 |
101,12 |
||||||||||||
|
t-Test |
1,979 |
1,1567 |
-1,879 |
-1,774 |
1,7437 |
0,5142 |
-0,166 |
0,9756 |
-2,503 |
1,7661 |
-0,148 |
-1,053 |
-1,586 |
|
MNCP85 |
Govex |
Trade Dep |
social sec |
UN-membery |
Women Parl |
Women %LF |
ln PCI |
ln PCI^2 |
ln(MPR+1) |
Fertility Rate |
%agland |
Constant |
|
|
ethno |
0,0102 |
0,1021 |
0,5162 |
-0,038 |
0,4516 |
0,0119 |
0,0318 |
0,023 |
-0,043 |
-1E-03 |
-0,017 |
0,0002 |
-2,072 |
|
warfare |
0,0108 |
0,1178 |
0,5883 |
0,2133 |
3,1854 |
0,0155 |
0,0245 |
0,0133 |
0,0389 |
0,0047 |
0,0139 |
0,0105 |
12,213 |
|
0,1152 |
1,6242 |
||||||||||||
|
1,1933 |
110 |
||||||||||||
|
37,776 |
290,19 |
||||||||||||
|
t-Test |
0,9403 |
0,8667 |
0,8773 |
-0,179 |
0,1418 |
0,765 |
1,2968 |
1,7257 |
-1,092 |
-0,208 |
-1,226 |
0,0144 |
|
|
MNCP85 |
Govex |
Trade Dep |
social sec |
UN-membery |
Women Parl |
Women %LF |
ln PCI |
ln PCI^2 |
ln(MPR+1) |
Fertility Rate |
%agland |
Constant |
|
|
destab./ |
0,0022 |
0,0166 |
0,0792 |
-0,029 |
0,4441 |
0,0021 |
-0,001 |
0,0074 |
-0,013 |
-8E-04 |
0,001 |
-0,002 |
-1,842 |
|
war |
0,0026 |
0,0279 |
0,1392 |
0,0504 |
0,7534 |
0,0037 |
0,0058 |
0,0032 |
0,0092 |
0,0011 |
0,0033 |
0,0025 |
2,8885 |
|
0,1319 |
0,3841 |
||||||||||||
|
1,3929 |
110 |
||||||||||||
|
2,4667 |
16,233 |
||||||||||||
|
t-Test |
0,876 |
0,5952 |
0,569 |
-0,579 |
0,5895 |
0,5772 |
-0,193 |
2,36 |
-1,38 |
-0,689 |
0,309 |
-0,853 |
|
MNCP85 |
Govex |
Trade Dep |
social sec |
UN-membery |
Women Parl |
Women %LF |
ln PCI |
ln PCI^2 |
ln(MPR+1) |
Fertility Rate |
Constant |
|
|
mean y |
-0,821 |
1,1775 |
0,5406 |
-6,526 |
0,02 |
-0,009 |
-6E-04 |
0,0817 |
-0,008 |
-0,012 |
-0,013 |
26,224 |
|
of educ |
0,0871 |
0,4429 |
0,1613 |
2,4078 |
0,0118 |
0,0184 |
0,0101 |
0,0286 |
0,0035 |
0,0105 |
0,0078 |
9,2048 |
|
ation |
0,8799 |
1,2288 |
||||||||||
|
73,939 |
111 |
|||||||||||
|
1228,1 |
167,61 |
|||||||||||
|
t-Test |
-9,419 |
2,6589 |
3,3519 |
-2,711 |
1,7038 |
-0,487 |
-0,055 |
2,8626 |
-2,385 |
-1,178 |
-1,647 |
|
|
MNCP85 |
Govex |
Trade Dep |
social sec |
UN-membery |
Women Parl |
Women %LF |
social sec |
ln PCI^2 |
ln(MPR+1) |
Fertility Rate |
Constant |
|
|
employ |
-1,729 |
1,3969 |
2,0486 |
-31,17 |
0,3784 |
0,1233 |
-0,05 |
-0,07 |
0,0436 |
-0,153 |
-0,06 |
156,76 |
|
ment |
0,4309 |
2,1905 |
0,7978 |
11,909 |
0,0581 |
0,0908 |
0,0498 |
0,1412 |
0,0175 |
0,0519 |
0,0385 |
45,529 |
|
0,5513 |
6,078 |
|||||||||||
|
12,397 |
111 |
|||||||||||
|
5037,6 |
4100,6 |
|||||||||||
|
t-Test |
-4,012 |
0,6377 |
2,5678 |
-2,617 |
6,5094 |
1,3583 |
-1 |
-0,493 |
2,4854 |
-2,939 |
-1,565 |
|
MNCP85 |
Govex |
Trade Dep |
social sec |
UN memy |
Women Parl |
Women %LF |
ln PCI |
ln PCI^2 |
ln(MPR+1) |
Fertility Rate |
|||
|
cpm |
5,6962 |
-9,65 |
-1,156 |
8,4534 |
-0,131 |
-0,029 |
0,0247 |
-1,711 |
0,0388 |
-0,14 |
-0,078 |
16,497 |
|
|
measure |
0,9599 |
4,9936 |
2,1929 |
31,463 |
0,1232 |
0,2494 |
0,1189 |
0,8804 |
0,0376 |
0,1178 |
0,0805 |
115,66 |
|
|
0,6509 |
12,162 |
||||||||||||
|
14,917 |
88 |
||||||||||||
|
24270 |
13016 |
||||||||||||
|
t-Test |
5,934 |
-1,933 |
-0,527 |
0,2687 |
-1,06 |
-0,117 |
0,2078 |
-1,944 |
1,0332 |
-1,186 |
-0,973 |
||
|
MNCPen85 |
ln PCI |
ln PCI^2 |
ln(MPR+1) |
Fertility Rate |
constant |
|
|
inequality |
1,660219 |
-5,34162 |
-2,13994 |
31,8547 |
0,12603 |
-73,7864 |
|
share top |
0,65447 |
3,456306 |
1,019608 |
15,49074 |
0,070035 |
59,09442 |
|
20% |
0,252326 |
7,897908 |
||||
|
4,92722 |
73 |
|||||
|
1536,726 |
4553,517 |
|||||
|
t-Test |
2,53674 |
-1,54547 |
-2,09879 |
2,05637 |
1,799521 |
Legend: as in all EXCEL 5.0 outprints in this work, first row: unstandardized regression coefficients, second row: standard errors, last row: t-Test. The values immediately below the standard errors are R^2 (third row, left side entry), F, and degrees of freedom (fourth row).
The above materials strongly support dependency theory. There are 19 variables and processes of development measured here. 14 variables are explaining different aspects of development. MNC penetration significantly and negatively affects 15 of the 19 dimensions reported, the rest - life expectancy increases, the greenhouse index, ethno-warfare, and the existence of war and political destabilization in a country, are still affected in a fashion, as predicted by our theory, but not significantly.
MNC penetration also increases significantly poverty, as measured by the new UNDP 1996 CPM poverty measure. International system participation age - or early statehood - is an important control variable in the whole process of the explanation of post-1982 growth and development/stagnation. It significantly enhances the increase of life expectancy over time, gender empowerment, and the educational and employment record of a given country (the strong points of long established nations), while it significantly fails to block the deforestation process, especially due to the divergence between professed ideals and dire realities in the long-established nations in Latin America and in Eastern Europe.
Terms of trade have a significant effect in the expected direction on the process of maternal mortality, and life expectancy. The most important further results are:
5) The contradictions of the process of the global environmental destruction, to which Europe as one of the main regions of world industry and traffic, disproportionately contributes
Over recent years, there has emerged a new sub-field of development and transformation theory, that is sensitive to the concerns of 'the new social movements' around the globe (Bello, 1989; Friberg, 1988; UNDP, 1993, 1994; Woehlke, 1987, 1993). The situation of women and the situation of the environment emerge as prime issues of development (Benard and Schlaffer, 1985; Betz and Bruene, 1995; L. R. Brown, 1992; Dubiel, 1993; Frank and Fuentes-Frank, 1990; Leggett, 1991; Saffioti, 1978; Seager and Olson, 1986). Cross-national analysis about economic and social preconditions and the quality of the environment are relatively new (Beckerman, 1992; Shafik and Bandyopadhyay, 1992).
Environmental disintegration
In the former or continuously communist countries of Eastern Europe and the USSR-successor-states, environmental quality poses indeed one of the main concerns of development planning nowadays (World Resources Institute, 1992). Eastern Europe's transformation could be again seen as a testing ground for various growth paradigms and strategies. The globalization argument would emphasize, that, contrary to the optimistic expectations about an improvement in the environmental situation due to the new presence of transnational capital, the adoption of an energy-consuming 'US-style'- model would mean a significant long-term increase of various emissions.
The global atmospheric carbon dioxide concentration increased from 280 ppm in pre-industrial times to 315.8 in 1959, to stand at 354 in 1990. World carbon dioxide emissions increased from 6.002 thousand millions of metric tons in 1950 to 21.863 thousand millions of metric tons in 1989. In 1995, CO2 emissions reached 23.1 thousand millions of metric tons (Fischer Weltalmanach, 1997). The United States are responsible for 4.88 thousand millions of tons, followed by China (2.67 thousand millions) and Russia (2.1 millions), followed by Japan (1.09 millions), Germany (0.88 thousand millions), India (0.77 millions) (Graph 5.1)
Graph 5.1: CO2-emissions in the world system (1995)
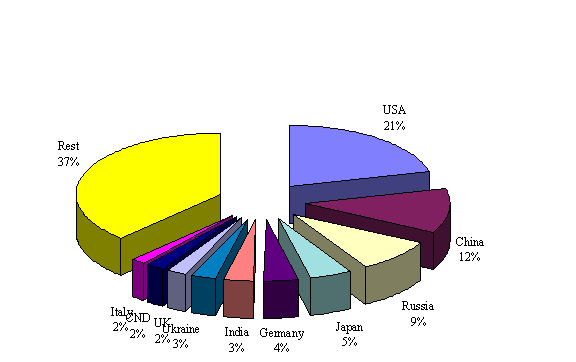
Source: our own calculations, based on Fischer Weltalmanach, 1997, based on Carbon Dioxide Information Centre. The graph shows the percentage share of major polluters in total world CO2 emissions.
Over the last 100 years, the earth’s temperature rose by 0.6 degrees; from 1970 to today, the rise was 0.3 degrees. The earth’s temperature will rise by a further 3.5 degrees until 2100, if contemporary emission trends continue (Stiftung, 1996). The most probable scenario, according to the Intergovernamental Panel on Climate Change (IPCC), reaches the conclusion that an increase of +2 °C on a global level and a rise of the sea-level by 50 cm is very probable (Fischer Weltalmanach, 1997: 1122). Severe storms, droughts, and other catastrophes would be the immediate consequence. In terms of the average temperature for the three decades 1961-90, 1995 presented an increase of +0.4 °C (Fischer Weltalmanach, 1997: 1122, based on Hadley-Center, 1996). From 1910 to the end of the Second World War, there was a thirty year increase in temperatures, to be followed by two troughs around 1950 and 1968 and a continuous rise since the end of the 1970s (Fischer Weltalmanach, 1997: 1122).
Over the last 160000 years, there has been a close correlation between carbon-dioxide concentrations and changes in the world temperature (Gore, 1994; Leggett, 1991). Roughly, a change of +- 100 ppm carbon dioxide historically led to a change of +- 12.5 degrees Celsius. From 1750 to today, carbon dioxide emissions amount to 800 thousand million tons of CO2. Although the temperature change factor might be smaller, and a rise by 100 ppm CO2 might lead to a temperature rise of 1.1 degrees, the heating of the atmosphere in the coming decades will be enormous:
Graph 5.2 Charles D. Keeling’s data series from Mauna Loa - atmospheric concentrations of greenhouse and ozone-depleting gases, 1959-90, and the trend for the next 60 years
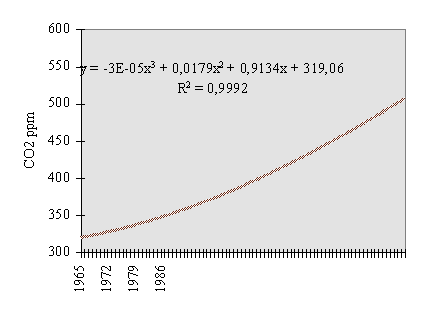
Legend: CO2-concentration on Mauna Loa, Hawaii, measured in particles per m3. Our own calculations from D. Keeling’s data, Scripps Institution of Oceanography, World Resources Institute, 1992, using the trend-line extrapolation of the EXCEL 5.0 program (3-order polynomial expression).
Desertification, storms, flooding in many parts of the world, as well as famine and droughts could be the results of these recent increases in carbon dioxide levels and are indeed already a reality in many parts of the world. There were 16 major disasters in the 1960s, 29 in the 1970s, and 70 in the 1980s. Natural disasters now strike 120 million people each year (UNDP, 1997). Since 1967, 1.3 million people died from droughts, 800000 in cyclones, 600000 in earth quakes and 300000 in floods (UNDP, 1994). The last time, that a carbon dioxide concentration as high as around 300 ppm was reached in the earth’s history, was around 130000 before our time; from that moment onwards, global temperatures and carbon dioxide concentration ratios fell to 20000 before our time, when a level of just 180 ppm was reached. And again, the poor have to pay the bill: Bangladesh produces only 0.3% of global greenhouse emissions but could see its land area shrink by 17% due to global warming (UNDP, 1997).
An important question is, whether or not the recurrence of major floods and hurricanes in our age is coincidental or connected to global warming. In the summer of 1997, Europe again was hard-hit by extensive floods, just as in summer 1996. In 1996, the Netherlands were hardest hit, and in 1997, Poland and the Czech Republic. Apart from the social aspects of these disasters, which bring to the surface the vulnerability of the social structures of people living in poverty, there are severe ecological implications. The delicate long-standing oscillations in the velocity and temperature of Oceanic currents intervene. Precisely this delicate balance seems, one could tentatively argue, to have been upset now in a fundamental way: already in 1991 it was discovered that the velocity of the Gulf stream northeast of Iceland decreased by 80%, thus affecting the equilibrium between the salt-content of the Oceanic waters, the velocity of Oceanic circulation, and the cold winds from the North Pole (Gore, 1994). A huge, powerful current usually carries warm water from the vicinity of Florida to the coast of Ireland before turning westward, cooling, sinking, and going back south near Labrador. Deep-lying parcels of unusually warm water move continually through that pipeline, alternating with cooler ones, along with the rhythm of sun-spot activity. Each parcel takes about 20 years to travel from the tropics, around the North Atlantic circuit to Labrador. Sea-surface temperatures rise and fall in concert with the movement of these parcels (New York Times, March 18th, 1997). Since the 1970s, the North Atlantic oscillation and a similar oscillation in the Pacific have made the continents of the Northern hemisphere unusually warm, during winter and spring (New York Times, March 18th, 1997). ‘El Nino’, that vast pool of unusually warm surface water that comes and goes every few years in the eastern tropical Pacific, and first discovered around Christmas by Peruvian fishermen 200 years ago, is a similar phenomenon (Los Angeles Times, May 16th, 1997), that, in the past, was followed each time by ‘La Nina’, the corresponding pool of cold water in the rhythm of two to seven years (NY Times, June 3rd, 1997):
In their search for convincing evidence of global warming, scientists have
been puzzling over shifting tree lines in the Sierra Nevada, dying coral in
the Caribbean, melting alpine glaciers, and seasonal temperatures so
extreme that the 10 warmest years of the past century have occurred in the
last 15 years.
When malaria-infected mosquitoes recently turned up in New Jersey and
tropical microorganisms were discovered poisoning shellfish as far north as
Monterey, climate experts were quick to wonder whether they had detected
evidence of climate changes.
In each case, pests once confined to the world's hottest regions appeared
to be moving into new territory--evidence, perhaps, of formerly cool zones
warmed by greenhouse gases.
Now some researchers believe that they have detected the distinctive
signature of global warming in the infamous Pacific Ocean current known as
El Nino, a seasonal upwelling of warm seawater that has been implicated in
disastrous droughts, torrential rains, killing heat waves and other
distortions of the daily weather from Southern California to South Africa.
The El Nino current arises from the dance between order and chaos as the
ocean and the atmosphere interact to balance the Earth's thermal energy. It
is the heart of a complex system called the El Nino Southern Oscillation,
which is so delicate that even a subtle alteration in temperatures can
affect its seesaw, annual rhythms.
Global warming should make El Nino effects stronger and more frequent, said
Kevin Trenberth of the National Center for Atmospheric Research in Boulder,
Colo. And, as if to prove his point, the most recent El Nino, which some
scientists say lasted from 1990 through 1995, is the longest in 130 years
of record-keeping (Los Angeles Times, May 16th, 1997)
The emerging pattern seems easy to predict: milder and drier winters in Alaska, Canada, and the Pacific Northwest, cooler in the Southeastern United States and wetter in the US Southwest. Powerful west-to-east winds across the Atlantic bring more oceanic warmth to Northern Europe and Asia, making for milder winters there. Northern Europe gets more precipitation, while Southern Europe and the Middle East less. Until now, the oscillations in Oceanic currents caused ups and downs in world weather cycles, causing a shift of the westerly winds to the European South, making Northern Europe much colder and drier and bringing more warmth and precipitation to Mediterranean Europe, Africa and the Middle East. The Medieval warm period and the Little Ice Age were all - current opinion goes - a consequence of previous such oscillations (New York Times, March 18th, 1997). The question is of course, whether or not we’re in for a more secular change, that seems to be directing towards more hurricanes in the Southeastern US, more torrential summer rains in Europe, and Western Latin America, and more droughts in many other parts of the world, among them Australia and many parts of Asia. It might also well be that the ‘peaks’ in the common re-occurrence of the ‘El Nino’ phenomenon get larger, up to five years (Los Angeles Times, May 16th, 1996). Several meteorologists, among them Timothy Barnett at the Scripps Institution of Oceanography, rule out the connection between ‘El Nino’ and global warming, however. Their arguments say that similar prolonged El Ninos were observed during 1911 to 1915, and that volcanic eruptions, deep-sea thermal events or the 11 to 22 year sun-spot cycle may cause the phenomenon. Indeed, they’d argue that up to 50% in global temperature rise since 1900 must be attributed to a rising sunspot activity, and not to Carbon Dioxide levels (LA Times, ibidem). Fairly safe predictions estimate however, that up to a third of the world’s glaciers will melt away over the next decades, together with a 2-6 degrees Fahrenheit rise in average surface temperature and a rise in the sea levels up to three feet during the next 100 years (LA Times, ibidem). Such huge fresh water supplies from the Antarctic to the South-east Pacific, and from Greenland and the Arctic to the North Atlantic would in turn explain, why less salt water submerges and becomes colder in the process, moving southward along North Americas coastline. However, there seems to be rising consensus that severe hurricanes will continue to develop in the Atlantic arena over the next years (New York Times, June 3rd, 1997). The hurricanes are facilitated by the warming up of the tropical zones of the Atlantic, but expected to be kept in check at least in part by the El Nino phenomenon. The coincidence of the cold La Nina in the Pacific and higher Sea surface temperatures in the tropical Atlantic, which have risen since 1955 in almost continuous fashion, would however combine to create terrible hurricanes that will hit the Eastern USA in the not too distant future (NY Times, ibidem). It should be recalled, that wet weather and low pressure areas in Africa’s Sahel zone are at the root of hurricane embryos, kept in check by high-level westerly winds blowing from the Eastern tropical Pacific, and caused by El Nino (NY Times, June 3rd, 1997). One plausible hypothesis is of course:
One of the most powerful indicators, according to the new study by Dr.
Saunders and Andrew R. Harris, climate scientists at University College
London in Britain, is the Atlantic sea-surface temperature. Their
statistical analysis found that while most of the relevant factors were
indeed favorable for hurricane development in the banner year of 1995, the
dominating influence was the unusually warm ocean. The temperature in the
region where hurricanes develop was 1.2 degrees Fahrenheit above the
1946-1995 average, a record. The development region was 0.36 of a degree
warmer than average last year and is about 0.9 of a degree warmer now.
This, said Dr. Saunders, presages another active season. His study appeared
in the May 15 issue of the journal Geophysical Research Letters.
The researchers suggest that warmer seas cause more water to evaporate from
the surface. With evaporation, latent heat is released in the atmosphere,
and the researchers believe that this is what imparts more energy to the
embryonic storms coming out of Africa, making it more likely that they will
develop into hurricanes. "It seems that this is a stronger effect that any
other mechanism, like El Nino or the monsoon in the western Sahel," Dr.
Saunders said.
The question, he said, is whether the rising sea temperature is a natural
expression of the climate system's variability, independent of any
influence from a warming atmosphere. Dr. Gray, for his part, says he
believes the warmer ocean temperature is "a manifestation of a major change
in North Atlantic ocean circulation." Stately currents in the North
Atlantic undergo periodic shifts on decadal time scales. Dr. Gray said he
believed that a new pattern was in place, and that it was likely to presage
a decade or two of above-average hurricane activity.
"This is the greatest fear we have," he said, "that we're entering a new
era. I believe we are." (New York Times, June 3rd, 1997)
In the northern hemisphere, regions north-east of the warming Ocean regions receive above than average rainfalls, while in the southern hemisphere, regions south-east of the ‘El Nino’ area receive the highest rainfalls. On the western shores of the Pacific and the Atlantic, severe droughts can develop during the summers, in regions as far apart as North Korea, Australia, and Eastern Canada. Severe storms are to be expected in countries or regions like Western Mexico, Peru, and Chile (Reuters, North America News Report, July 15th, 1997). World poverty and environmental degradation in marginal lands are closely inter-linked with such phenomena. During the last El Nino, which happened in 1982-83, hundreds died in Peru in flood and landslides, and tens of thousands were left homeless:
Chicago--Jun 27--The current El Nino has been one of the fastest
growing El Nino weather events this century, and sea surface temperatures
are expected to continue rising into the fall and winter, Smith Barney
weather analyst Jon Davis said in a special report.
Pacific Ocean surface temperatures began to rise at the beginning of
the year and have continued to climb at a steady pace ever since, Davis
said in an El Nino update.
"The increase in SSTs during the past 6 months has been the most
dramatic of any 6-month period since the late 1970s," he said. "In fact,
this is one of the most dramatic warmings over such a short period of time
this century."
The La Nina--colder-than-normal water temperatures in the Pacific--
ended in March, with the 1995-96 event lasting a little more than 2 years.
By early May, sea surface temperatures had risen enough to declare an
El Nino event. The continued rise in those temperatures in the past 6 weeks
has been enough to classify the event as moderate, with current
temperatures about 1.5 degrees Celsius above normal.
"If the current rate of change continues at the same magnitude, the El
Nino event will be ranked as a strong one within a matter of months," Davis
said.
(...) Areas that normally see dryness and heat during El Nino events include
China, India, Southeast Asia--Indonesia, Malaysia, Thailand, Philippines--
and Australia.
The problems in Asia mostly are due to a lack of irrigation caused by
poor summer and fall rains. Australia also typically sees very dry
conditions in El Nino years.
"The more that SSTs in the Pacific warm up, the more likely it is for a
major drought during the spring and summer (Oct-Feb) across the continent,"
Davis said.
Along with these potential problem areas, the weather event could cause
difficulties in South Africa during that region's corn planting season in
October and November.
(...) The strengthening of the event decreases the chances of an active
hurricane season in the Gulf of Mexico and Atlantic, Davis said (...)
If the sea surface warming continues into the fall and winter as
expected, a warmer 1997-98 winter could result in Canada, the US and
Europe, he said. (Bridge World Markets News, at http://www.dialogselect.com)
More than 500 million poor people live on marginal lands in the Sahel and in the upper regions of the Andes and the Himalayas. Their main preoccupation will not be with the price of commodities that you can sell, but with survival as such. Dry lands are the home to 1.5 billion people on earth. Conflicts between farmers and herders are proliferating in Africa and in Asia (UNDP, 1997). The tragic events in Rwanda and Burundi cannot be separated from two processes a) these conflicts b) the structure of land intensive raw material exports, like coffee growing, imposed by the structures of world tariffs and world trade, on Africa (Amin, 1994). The water supply per capita in developing countries today is only a third of what it was in 1970. More than 55% of the people in the Arab world suffer from serious water shortages. Over the past 50 years, 65 million hectares of productive land have become desert globally (UNDP, 1997).
World pollution is even a clear statistical function of the ups and downs of the longer swings in the world economy, most notably the Kuznets cycle and the Kondratieff cycle. The World Resources Institute has provided information on the basis of the Carbon Dioxide Information Analysis Center about CO2 emissions in the world from 1950 onwards. The growth rates of CO2 consumption clearly correspond to the Kondratieff and Kuznets cycle analysis about economic growth, which we introduced in Chapter 3.
Graph 5.3: CO2 emissions and their growth rates from 1950 onwards
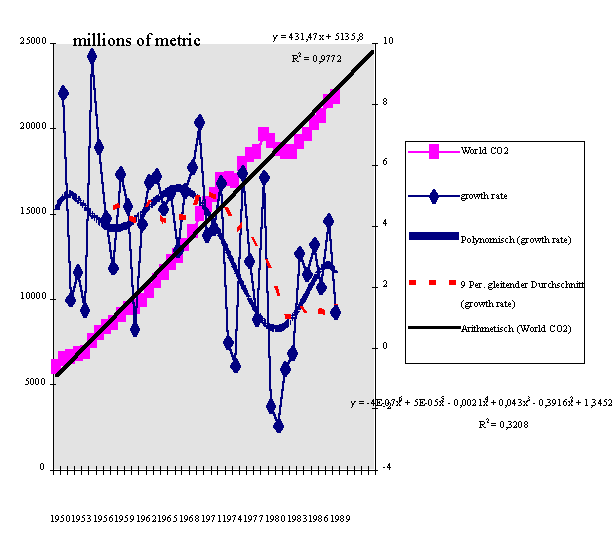
Legend: World CO2 emissions from fossil fuel consumption and cement manufacture, 1950-89. Left hand scale: emissions in millions of metric tons per year; right-hand scale: growth rates of these emissions. The graph shows also the polynomial expression (6th order) of these growth rates, as calculated by EXCEL 5.0, as well as the gliding averages on a 9-year basis. The dark line is the linear regression trend of CO2 emissions, projected for 5 consecutive periods
About 700 million people, mainly women and children, inhale indoor smoke from burning biomass fuel. Air pollution causes losses of $bn 35 a year in Europe, costing farmers $bn 4 in Germany and $bn 2 in Poland. The smoke-stack landscape of north-central Europe, that ranges from Northern England, via Belgium, northern France, north-eastern Germany to Poland, the Czech Republic, Slovakia, the Ukraine and other parts of east-central Europe presents a high concentration of SO2 emissions, rapid defoliation and scarce water resources. Table 5.1 and Map 5.1-5.2 now summarize the most important environmental and social indicators for the region before or during the start of the transformation process. Defoliation and forest destruction in turn increase the probability of flooding, because the water masses, pouring down with the rains, cannot be properly soaked into the earth anymore:
Table 5.1: environmental quality in Eastern Europe and the former USSR in comparison to the US, the UK, France, (West) Germany, Sweden and Austria
|
Country |
Environmental degradation indicator |
|||
|
CO2 |
SO2 |
NOX |
% forest defoliation |
|
|
per capita emissions (tons) (in industry) |
moderate to severe |
|||
|
Albania |
3.04 |
15.6 |
2.8 |
- |
|
Bulgaria |
11.87 |
114.6 |
16.7 |
24.9% |
|
former CS |
14.47 |
178.9 |
60.7 |
33.0% |
|
East Germany |
- |
313.3 |
42.6 |
16.4% |
|
Hungary |
6.05 |
115.2 |
24.5 |
12.7% |
|
Poland |
11.54 |
103.3 |
39.1 |
31.9% |
|
Romania |
9.16 |
8.6 |
16.8 |
- |
|
former Yug. |
5.61 |
69.6 |
8.0 |
22.6% (Slovenia) |
|
former USSR |
- |
32.4 |
14.6 |
35.0% (Kalinin- |
|
grad oblast) |
||||
|
USA |
19.68 |
83.2 |
79.6 |
- |
|
UK |
9.89 |
62.1 |
43.9 |
28.0% |
|
France |
6.38 |
27.1 |
30.1 |
- |
|
W-Germany |
10.48 |
24.2 |
48.4 |
15.9% |
|
Sweden |
7.0 |
25.9 |
35.4 |
12.9% |
|
Austria |
6.82 |
16.3 |
27.7 |
4.4% |
Source: our own compilations from World Resources Institute, 1992
Map 5.1: defoliation in Central and Northern Europe’s forests
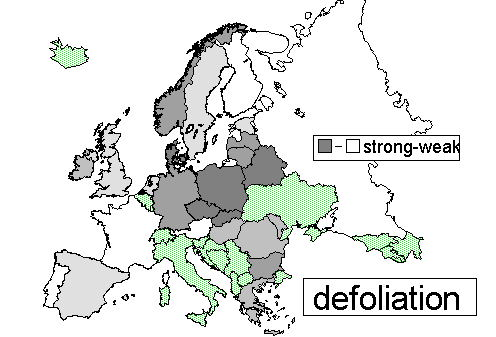
Source: Polish Central Statistical Office, 1996, Ochrona Srodowiska. The darker, the stronger the defoliation process
Map 5.2: internal renewable water resources per capita
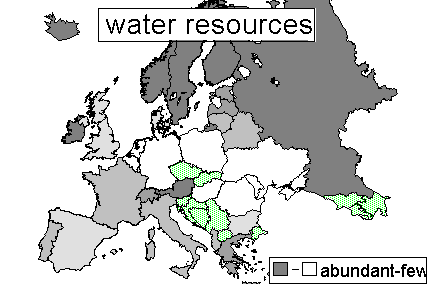
Source: EXCEL 7.0 graph, based on UNDP 1996 data and Fischer Weltalmanach. The lighter, the more severe is water scarcity already.
The short-run prediction thus points towards more severe flooding in Eastern Europe over the next years, to be followed by desertification. Forests have the unique capacity of attracting rainfalls by emitting terpenes (C5H8) and dimethylsulphides (Gore, 1994).
Deforestation in Eastern Europe and the former USSR is already more severe than in most parts of Western Europe. Defoliation is a more than serious problem in North-Central Europe, where water scarcity is also extending. To this we must add, that in a country like Poland environmental concerns do not receive the priority that they should receive. Only 34% of the population is served by waste water treatment plants (EU average 70%); municipal waste services reach only 55% of the population (EU average: 96%; our own compilations from UNDP, 1995). The basic argument of a globalization-oriented explanation of environmental quality on a world scale (Launer, 1992; Woehlke, 1987) would run as follows: dependent growth not only leads to social strains and imbalances, with all its economic dynamics that it might initiate at the same time; it also means a further strain on the natural resources and the environment by the energy-, space-, forest- and individual-traffic intensive life-style that capitalism, especially in its North American variety, brings about. Although some forest-, energy- and emission-saving might be the initial consequence of the introduction of more modern and western technologies, the basic problem of dependent and polarizing development would remain on the agenda. Profit-oriented growth between unequal partners will always, globalization theory argues, lead to forms of 'unequal exchange'. Concretely, the world-wide market economy and the new international division of labor will (i) transfer energy and pollution intensive industries to the countries of the periphery and the semi-periphery (ii) industrial waste from the centers will be increasingly attempted to be deposited in those regions (iii) export-intensive industrialization and the debt crisis will mean an almost reckless use of remaining natural resources, especially forest areas, for export purposes to earn badly needed foreign cash, or to destroy forests to gain land for tropical and sub-tropical export agriculture. International tourism (including its 'soft-body'-component), air traffic, individual traffic and the 'western' lifestyle, that begins with the plastic bag, ranging over well-known soft drinks - preferably from the tin-can - to equally well-known western TV-serials, will in the end more than negatively compensate the initially positive contributions, that economic transformation, market mechanisms and the recession of the 1980s will have meant for the countries of the periphery and the semi-periphery of Eastern Europe and the countries of the South in terms of the environment. Poland produces today more waste per inhabitant already (1500 kg per year) than Spain, Italy, France, the UK or Germany (1021 kg) (Wprost, 20.09. 1995: 52). Poland might have new factories for paper recycling with western technology, but the raw material - old paper - is being imported from Western countries, because there is no recycling and Poles have to throw old newspapers into the dustbin, for lack of proper recycling boxes in most parts of major Polish cities. Turn-key paper recycling factories in Poland, this is no joke, built by Western capital after the transformation, are now importing old paper from the European Union countries, because in Poland there is too few recycling (direct communication from the representative of a major Austrian enterprise in Poland to the author). Privatization of garbage collection is not so much on the agenda as the privatization of heavy industry - who cares, after all, about the mountain of waste, that is created by dependent capitalist development?
In addition, regional development authorities throughout Eastern Europe and in other semi-peripheral regions will hope to attract foreign buying power in exchange for local property rights in environmentally still undamaged regions. Insert here what you like: Caribbean island coasts, still untouched regions in Eastern Europe, like the Mazurian lakes, the Tatra mountains, et cetera. They will share the fate - dependency theory would tell us - of the sell-out on the Spanish Mediterranean coast, wide areas of the Austrian Alps and many other places in Europe. In other zones, unabated deforestation will develop, not unlike many Third-World countries. Unequal environmental exchange will increasingly affect (semi)peripheral regions in greater geographical distance from the centers; mass tourism to the tropical zones of the world will cause a tremendous increase in air-pollution from air-traffic that these 'island get-aways' bring about. For these reasons, environmental indicators are so negatively determined by transnational penetration. An important control variable in our analysis of the deforestation process is the percentage of total land, devoted to agriculture. On the one hand, it allows for the fact, that large regions of the world are affected by a growing desertification; on the other hand, this control variable duly considers the negative effect, that the expansion of world agriculture had on the world’s woodlands in a historic perspective.
It is hard to construct a single indicator of the environmental situation of a country. The following indicators are being used widely: the greenhouse index per 10 million people, energy consumption per capita, and the annual rate of deforestation. A fourth indicator, per capita carbon dioxide emissions, is also available. The greenhouse index measures the net emissions of three major greenhouse gases: carbon dioxide, methane and chlorofluorocarbons. The index weights each gas according to its heattrapping quality in carbon dioxide equivalents and expresses them in metric tons of carbon per capita. Energy consumption, on the other hand, refers to commercial forms of primary energy - petroleum (crude oil, natural gas liquids, and oil from non-conventional sources), natural gas, solid fuels (coal, lignite, and other derived fuels), and primary electricity (nuclear, hydroelectric, geothermal, and other) - all converted into oil equivalents. Energy consumption refers to domestic primary energy supply before transformation to other end-use fuels and is calculated as indigenous production plus imports and stock changes, minus exports and international marine bunkers. The use of firewood, dried animal excrement, and other traditional fuels is not taken into account for lack of international comparative data. Energy consumption per capita can be considered as perhaps the most important single indicator of the factors, that lead to global environmental degradation. The two environmental indicators have a very high positive correlation with each other. The third indicator, annual rate of deforestation or total forest area (under proper consideration of arable land per total land), is connected with the first and the second process in a complex fashion. For the future of the world environment, deforestation is the most alarming contemporary process of environmental degradation. Forest burning directly leads to a greatly increased CO2 emission; deforestation reduces the world's future capacity to produce oxygen and to adapt to increasing CO2 levels. To put it into a drastic comparison with medicine: the patient suffers from cancer on the left lung (the green house-effect), but the doctors decide to extract the still functioning right lung (the world-wide CO2 --> O2 photosynthetic regenerative capacity of the world's tropical forests). Due to the destruction of the outer ozone-layer of the earth, this fatal process will still be increased. Each second, a rainforest area as large as a football field, is being demolished on purpose (Launer, 1992).
Among the factors, leading to deforestation, the export-oriented economy, the use of tropical wood in the world paper and furniture industry, and the burning of wood for cooking and heating purposes are the three most commonly mentioned factors. A great number of scholars, among them Leggett et al., 1991, tried to bring deforestation rates systematically into a causal relationship with the kind of dependent capitalist growth, analyzed amongst others by Bornschier and Chase Dunn, 1985. The creation of large plantations in Latin America for meat exports to the United States of America is often causally linked in the literature to the problem of deforestation (Launer, 1992). Brazil's supposed role is of special importance here, because Brazil still has a share of 27.5% of the world's tropical forests. Indonesia's year-long wood-export drive has often been mentioned as the most paradigmatic case of the influence of the capitalist world economy on the rapid disappearance of the world's forests. The role of the peasantry in dependent capitalism was also often mentioned in this context. Extensive tropical agriculture, implanted by 500 years of dependent development, described by the Peruvian Marxist José Carlos Mariateguí in his classic '7 Essays', and later on analyzed by Feder, 1972, is thought to be one of the main factors leading to the alarming rates of deforestation. Small scale peasants - the dependencia argument runs - are evicted throughout the countries of Latin America, Africa, Asia and the Pacific from their meager holdings by the land-hungry process of dependent agricultural capitalism for the sake of export-oriented breeding for meat production and tropical export crops. Language and cultural barriers have prevented Mariateguís work from becoming known to a larger audience (and if anything, most social scientists today will know him only from the lamentable fact that the Peruvian terrorist group Sendero Luminoso usurped his name by calling itself Partido Comunista del Peru del Sendero Luminoso del Pensamiento de José Carlos Mariateguí; i.e. the Comunist Party of Peru of the Shining Path of the Thinking of José Carlos Mariateguí). But Mariateguís analyses of the workings of tropical agriculture are a superb and masterly piece of social scientific analysis of the crisis conditions of our world at the turn of the millenium, with its confrontation between the industrial center and the tropical agricultural periphery, which more and more resembles the conditions of the decline and fall of Ancient Rome (Chase-Dunn and Hall, 1997).
What is already commonplace in the former 'Third World' could become a rule of the day also in the former 'Second World'. Forests are being cut down not only in Indonesia and in Northern Borneo at an amazing speed, but also in the Warmia region of the Mazurian lakes in Poland and in other parts of Eastern Europe. Forest cutting for export purposes, disregarding the social and ecological rights of the local populations could serve, a dependencia-minded argument could maintain, the short-term profit interests of the old and new export-oriented elites.
6) Gender discrimination and sexism in world capitalism
Europe must not only come to terms with the environmental destruction, to which it contributes disproportionately on a global scale, Europe must also lead the way in bringing about a lean and socially just state at the same time. Social justice, by and large, means gender justice today (UNDP, 1995). The eastward expansion of the Union will further increase this problem dimension.
Faced by the marginalization of women on the labor markets due to the workings of globalization, Europe is tempted to spend its way out to maintain its position in a global context. The eastward expansion of the Union will mean, that millions of up to now economically marginalized women will become citizens of the Union, whose fate has to be taken care of by Brussels at least in some way.
Aggregate societal data suggest that after the transformation, the situation of women in Eastern and Central Europe did relatively deteriorate in many ways (Cornia, 1993, 1994). Since Cornia's very telling research results are easily available internationally, it might suffice here to quote some aggregate UNDP data to further illustrate our point. Our aggregate data show, how difficult a relatively rapid integration of the more traditionalist, rural and in many ways backward East into the European Union could become. Only the Czech Republic is socially by any means on a comparable level with the more highly developed countries of Western Europe:
Table 6.1: the marginalization of women, social devastation and decay in former communist countries of Central and Eastern Europe in comparison to the European Union countries
|
Indicator |
CS |
H |
BUL |
PL |
ROM |
ALB |
EU |
|
maternal mortality |
|||||||
|
per 100000 live births |
14 |
21 |
40 |
15 |
210 |
100 |
9 |
|
sulfur and nitrogen |
|||||||
|
emissions per capita |
239 |
141 |
- |
141 |
- |
- |
74 |
|
Rapes per 100000 |
|||||||
|
women |
12 |
31 |
21 |
19 |
- |
- |
17 |
|
homicides by men |
|||||||
|
per 100000 |
1.3 |
3.5 |
4.0 |
2.5 |
1.6 |
||
|
prisoners per |
|||||||
|
100000 inhabitants |
- |
142 |
160 |
204 |
- |
- |
59 |
|
suicides by men per |
|||||||
|
100000 |
30 |
58 |
23 |
24 |
13 |
- |
19 |
|
total health expen- |
|||||||
|
diture as % of GDP |
5.9 |
6.0 |
5.4 |
5.1 |
3.9 |
- |
8.2 |
|
mean years of schooling |
|||||||
|
female population >25y. |
8.6 |
9.9 |
6.4 |
7.8 |
6.7 |
5.2 |
9.9 |
|
mean years of schooling |
|||||||
|
male population >25y. |
9.8 |
9.7 |
7.6 |
8.5 |
7.5 |
7.2 |
10.3 |
|
tertiary graduates as |
|||||||
|
% of population of nor- |
|||||||
|
mal graduate age |
11.8 |
6.4 |
6.4 |
6.6 |
2.2 |
1.7 |
12.6 |
|
average age of women |
|||||||
|
at first marriage |
22.2 |
22.4 |
21.1 |
22.8 |
21.1 |
20.4 |
25.1 |
|
% of seats in parlia- |
|||||||
|
ment occupied by |
|||||||
|
women |
9% |
7% |
13% |
9% |
3% |
6% |
13% |
|
human development index |
|||||||
|
rank on the world scale |
27. |
31. |
48. |
49. |
72. |
76. |
- |
_____________________________________________________________
Source: our own compilations from UNDP (HDR, 1994). The world rankings of the EU countries on the human development index are:
|
Sweden |
4. |
|
France |
6. |
|
NL |
9. |
|
UK |
10. |
|
Germany |
11. |
|
Austria |
12. |
|
Belgium |
13. |
|
DK |
15. |
|
SF |
16. |
|
LUX |
17. |
|
IRE |
21. |
|
Italy |
22. |
|
Spain |
23. |
|
Greece |
25. |
|
Portugal |
42. |
Gender empowerment, as it is known, combines parliamentary seats, held by women, the share of women in the total number of administrators and managers in a country, the share of women in the professional and technical workforce, and the share of women in earned income (UNDP, 1996). Table 5.3 shows the performance of the transformation countries in comparison to Western democracies:
Table 6.2: gender empowerment
|
CND |
0.685 |
|
USA |
0.645 |
|
Japan |
0.445 |
|
NL |
0.646 |
|
NOR |
0.786 |
|
SF |
0.710 |
|
France |
0.437 |
|
SW |
0.779 |
|
Spain |
0.490 |
|
Australia |
0.590 |
|
BLG |
0.580 |
|
Austria |
0.641 |
|
NZ |
0.685 |
|
CH |
0.594 |
|
UK |
0.530 |
|
DK |
0.718 |
|
GER |
0.654 |
|
IRE |
0.504 |
|
ITA |
0.593 |
|
GRE |
0.370 |
|
ISR |
0.485 |
|
HUN |
0.507 |
|
POL |
0.431 |
|
BUL |
0.486 |
Source: our own compilations from UNDP, 1996
Eastern Europe, finding itself at the absolute lower middle range of the continuum between backward and 'modern' societies, characterized by the values of education as an end in itself, self-realization outside traditional role patterns, associated with child-bearing and the family, control of male aggressive behavior and a developed social welfare system, socially belongs much more to the countries, still (semi-)characterized by traditional role patterns. In the industrialized world, countries as different as Japan, France, Israel and Greece also have a gender empowerment index lower than 0.500. They all have in common a certain secondary role of women in public life, as compared to the real world leaders in terms of emancipation, like the Protestant democracies in Scandinavia, the Netherlands and Canada. The unquestionable advances in the relative role of women, that were evident throughout the region before the year 1989, came to a grinding halt after the transformation. With the background of the general poverty levels, sketched above, the socially disruptive dimension of this conflict becomes evident.
For the political economy of the world system, interesting research questions arise out of such tendencies. Does the market economy, especially in its dependent variety, in the end really marginalize women further, or does the (re)advent of full-fledged capitalism bring about a marked improvement in the social situation of women? There emerge very interesting results on the situation of women from our empirical investigations in Table 4.1.
Three measures are used to further test the relationship between globalization and gender-related human development. One is maternal mortality, the second is the UNDP gender-related development index, the third is the gender empowerment measure. The first and the third index are more distribution-oriented than the second indicator. Each year, 290 women per 100000 live births lose their lives in the moment of giving birth. What is the ultimate moment of happiness in a life for woman and man, to experience in togetherness the advent of a newly-born life, becomes the ultimate pain for millions of mothers around the world. They lose their lives due to the structural violence existing in the world system, they lose their lives in their ultimate moment of loneliness while giving birth, desolated and marginalized by a social order on the global level that produces more and more commodities, services and pollution but that forgets about the poor backyards, shanty towns and desolate clinics in the world poverty belts. The distribution conflict evident in the health sector, often under constraints from ‘structural adjustment programs’, has a real, deadly consequence for them. In the industrialized countries of the OECD, maternal mortality is 11 per 100000. That is to say, at the global level there is an 'excess mortality' of 279 women per 100000 live births, considering the progress in medicine reached at the level of the western democracies. In Eastern Europe, maternal mortality already reaches 66 per 100000 live births, and in the developing countries, 420. All three indicators of the female situation de la vie are being significantly blocked by MNC penetration (see Table 4.1).
Our results indicate that dependency is by far the most important determinant of maternal mortality, and that the two dependency-related indicators: terms of trade and trade dependency co-determine the process of maternal mortality in the world system. Our results also indicate that gender empowerment and gender development are significantly and negatively influenced by MNC penetration.
7) Development or decay?
More and more, the promise of growth that is inherent still in almost any government or other official international document on a world scale, is being challenged by the knowledge, that development under present conditions means decay. The world system scholar Richard K. Moore commented on the World Systems Network on my idea to speak about a theory of decay, and not a theory of development (<wsn@csf.colorado.edu>, 4th of August, 1997):
The biosphere is decaying - being polluted from all directions - and
various kinds of collapse are just waiting to happen, the question is only
one of timing. The environmental movement itself is decaying, removing the
main counter pressure to biosphere decay.
The nation-state system is being intentionally led to decay by the
neoliberal forces of globalization. Social services are being
systematically dismantled, governments are being bankrupted,
privatization/laissez-faire has become the effective religion of the day,
and national sovereignty is being dismantled economically, politically, and
militarily (...)
From everything, we have said, it should be clear that in theological/philosophical terms, we neither share - in the as yet unpublished words of scholar Alberto Moreira from Brazil (1997), - in the ‘colonization of the realms of life’ nor in the temptation to declare the ‘bankruptcy of modernity’. We cannot give up authentic conquests of modernity in the various fields of social life, that are in the service of the poor. We are sent straight back to the search for the human factor, for the integrity of being, that is the counterpoint to anxiety, alienation, solitude, the feeling of void and lack of meaning, which, according to Moreira, are the fruit of a life spent as isolated subjects surrounded by multitude of lifeless objects. Great masters of humanity, such as Buddha, St. Francis, the Polish Jewish doctor Janusz Korczak, who went with his children to the concentration camp, or the 19th Century French-Peruvian feminist Flora Tristan, or all these martyrs of faith during the totalitarian dictatorships of our Century, like Otto Neururer, a Tyrolean parish priest, murdered by the Nazis during the Second World War, all have shown a way beyond the civilization of commodities and power, and that this deficit in humanity cannot be compensated even by the greatest amount and abundance of things possessed (Moreira, 1997). Such philosophical reservations are not in vain. The social anomalies that accompany ‘growth’ are increasing on a world scale, making the very notion of ‘growth’ as the expression of ‘having’ instead of ‘being’ questionable more than ever before. The overweight consumer, buying an automobile and driving it down the next 200 meters for his shopping, increases more the real GDP of a society than the same person after his ‘conversion’ to buy a bicycle at less than 10% the price of his car (and by diligently using it thus probably avoiding a heart attack).
The following UNDP indicators for the western democracies (Canada through to Malta, 34 countries) were used to show the relationship between real GDP per capita in purchasing power parity rates and social and ecological anomaly:
prisoners per 100000 inhabitants
intentional homicides by men per 100000 people
drug crimes per 100000 people
reported adult rapes (thousands)
injuries and deaths from road accidents per 100000 people
suicides per 100000 people, male and female
divorces per 1000 couples
municipal waste in kg per person and year
Having more increases the contradictions of modern society in an often linear way; viz. more prison inmates, more murderers, more drug criminality, more sexual violence, more traffic accidents, more suicide, more unhappy marriages, and more waste. Above, we hinted at the ecological disasters, that the capitalist civilization and its philosophical twin brother, ‘real socialism’, brought or brings about on a global scale. Now it is to be shown, that development does not bring necessarily about happiness, but more often than not, social decay:
Graph 7.1: theories of development or theories of decay? Purchasing power and social decay in 34 developed western democracies
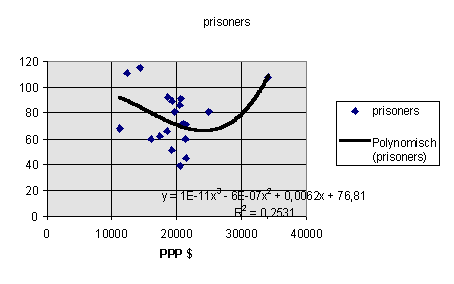
Legend: in this and in the following graphs, the x-axis symbolizes purchasing power parity rates in real US $, while the y-axis is a UNDP-indicator of social decay per total population
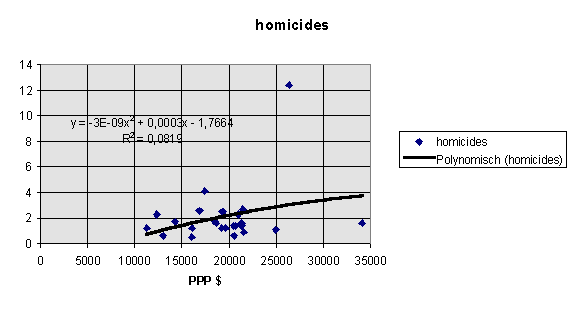
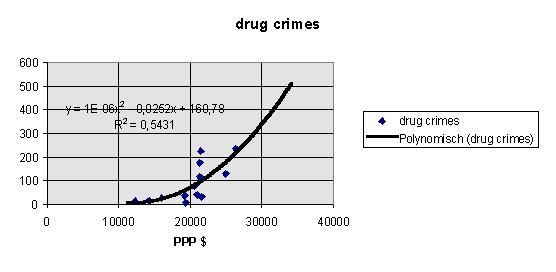
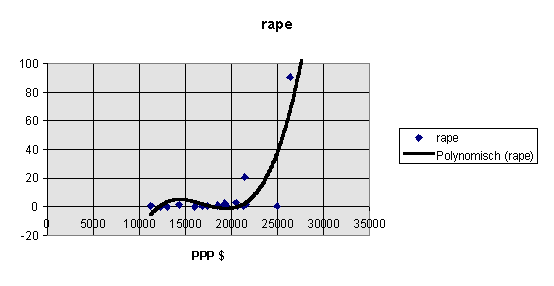
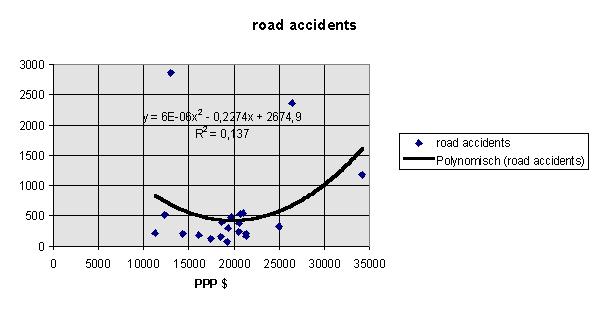
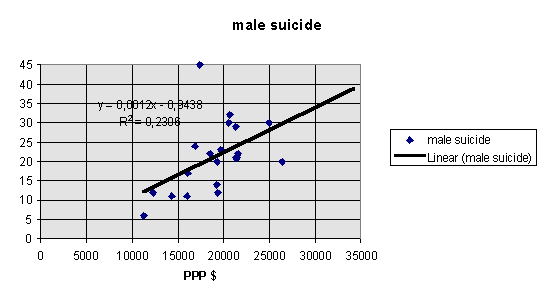
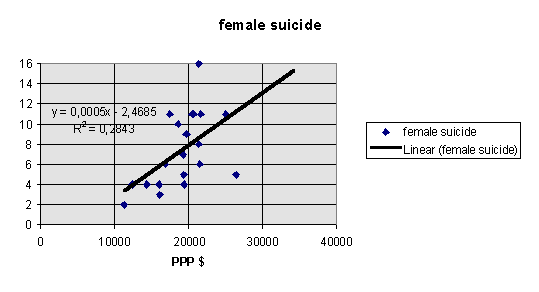
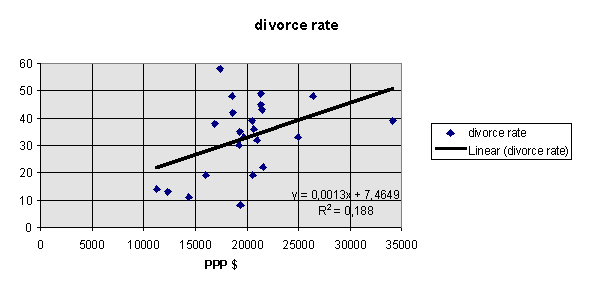
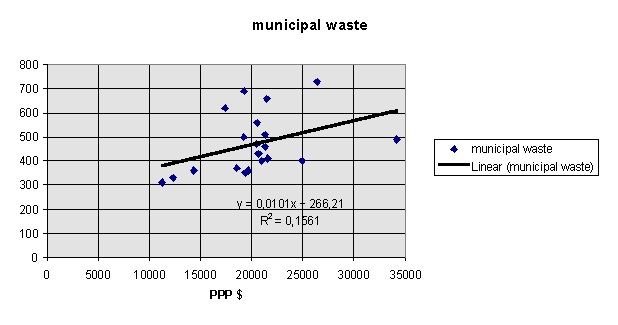
Thus, we are confronted with the limits of development, the central objective of the economy-dominated attempts at transnational integration.