‘For upward of a thousand years the tendency of the economic center of the world has been to move westward, and the Spanish War has only been the shock caused by its passing the Atlantic. Probably, within two generations, the United States will have faced about, and its great interests will cover the Pacific, which it will hold like an island sea (...)’ Brooks Adams (1900) ‘America’s Economic Supremacy’, as quoted in David and Wheelwright, 1989
‘The Ten Duties of Kings are: liberality, morality, self-sacrifice, integrity, kindness, austerity, non-anger, non-violence, forbearance, and non-opposition to the will of the people’ (Daw Aung San Suu Kyi, the Buddhist view of responsible kinship)
‘Although famines can kill millions of people, they do not kill rulers. Kings and presidents, bureaucrats and bosses, generals and police chiefs - these people never starve’ (Amartya Sen)
List of abbreviations and concepts (functional terms)
| a | constant in multiple regression analysis (statistics) |
| ACDA | Arms Control and Disarmament Agency (United States Department of State) |
| ASEAN | Association of Southeast Asian Nations |
| b1,2,3 | coefficients in multiple regression analysis (statistics) |
| BSE | bovine spongiform encephalopathy |
capability poverty measure (CPM-value) (UNDP, 1996. The measure weights
unattended births, underweight children, and female illiteracy. It is regarded
by the UNDP as a direct measure of absolute poverty)
| capitalism | our definition of capitalism is based on Samir Amin (1997): private property, wage labor, production of commodities, agricultural revolution, exponential growth |
| CEEC-7 | The following 7 Central and East European countries: Bulgaria, Czech Republic, Hungary, Poland, Romania, Slovak Republic, Slovenia |
| CEFTA | Central European Free Trade Area (as of 1.9.1995, Czech Republic, Slovak Republic, Poland, Hungary) |
| CIS | Community of Independent States (in the ex-USSR) |
| CO2 | carbon dioxide |
destabilization index (coded according to Weltalmanach, 1995. The indicator
codes all those countries as '1' (destabilized), that have entries about
serious armed internal or external conflict in 1994. The rest is coded
as '0'
| df. | degrees of freedom (statistics) |
| DYN HD | growth of life expectancy over time |
| DYN | variables, measuring growth (economic growth, human development et cetera) |
| E | Eulers number (2.7...) |
| EC | European Community, now: EU |
economic growth 80-93, pc. and year (UNDP, 1996)
| ECU | European Currency Unit |
| Employment | (UNDP, 1994) labor force as percent of total population |
| ENCONS | energy consumption per capita |
| EO/AA | equal opportunity and affirmative action laws in the United States of America |
ethno-linguistic fractionalization index, mid-1960s (Bornschier/Heintz, 1979, based on Taylor/Hudson). Ethnic discrimination is thought to be the purest form of a 'distribution coalition'
ethno-warfare (Gurr, 1994) magnitude of ethno-political conflict. The scores are country sums of the squared roots of the deaths (in 10s of thousands) from ethno-political conflict 1993-94 plus refugees (in 100s of thousands). Countries with no entries according to Gurr's main research results, 1994, are coded as '0'
EU membership years (Fischer Weltalmanach, 1995, 1996)
| EU | European Union (per 1.9.1995 15 member states) |
| EXCEL | a computer software for, amongst others, calculating statistics |
export processing zones (Bailey et al., 1993). The variable codes the
number of export processing zones per country at the beginning of the 1990s
| F | F-test-value in multiple regression analysis |
| F | productivities |
forest area per total land area (UNDP, 1993-95). In contrast to the
above indicator, that measures flows, this measure rather captures stocks
of already existent forest destruction. Agricultural land per total land
area has to be taken into consideration as an independent variable, because
else the regression equations would be biased by a desert-factor
| GDP | Gross Domestic Product |
gender empowerment measure (GEM) (UNDP, 1995. The index weights seats held by women in parliament, the percentage share of women and managers, the share of women in the professional and technical workforce, and the share of women in total earned income
gender-related development index (GDI) (UNDP, 1995) - dimension female life chances. This index was developed by the UNDP especially for the 1995 women's conference in Beijing. The index weights the share of earned income for females and males, the gender-specific life expectancies, the gender-specific adult literacy rates, and the gross primary, secondary and tertiary enrollment ratios. It ranges theoretically from 0.0 to 0.999, with Sweden (0.919) at the top of the international scale, and Afghanistan (0.169) at the bottom. Since there unfortunately no were no data for Dominica, Grenada, Antigua, Seychelles, Saint Lucia, Saint Vincent, Saint Kits, Belize, South Africa, Oman, Jordan, Gabon, Solomon Islands, Sao Tome, Congo, Rwanda, Bhutan, Angola, Mauritania, Somalia, Gambia, Germany and Israel, we had to substitute these missing values with averages for the socio-economic groups concerned: a) the industrialized democracies (gender development index average 0.87) b) developing countries with a Human Development Index above 0.6 (in our 123 nations analysis: Barbados to Tunisia, gender development index average 0.721) c) developing countries with a Human Development Index from 0.599 to 0.389 (Oman to Egypt, gender development index average 0,542) d) developing countries with a Human Development Index under 0.388 (except for the very least developed countries; Kenya to Sierra Leone; gender development index average 0.33) and e) the very least developed countries Benin, Guinea Bissau, Chad, Mali, Niger, Burkina Faso and Sierra Leone with a gender development index of 0.2. This procedure can be regarded only as a first approximation and should be substituted in future research
GNP Gross National Product
government consumption per GDP, 1990 (UNDP, 1993/94)
government expenditures per GNP, 1991 (UNDP, 1993/94; UNICEF, Regional Monitoring Report, 1, 11, 1993, see Cornia, 1993; World Resources Research Institute)
greenhouse index, 1989 (greenhouse index per 10 million people, UNDP,
1994. The greenhouse index measures the net emissions of three major greenhouse
gases: carbon dioxide, methane and chlorofluorocarbons. The index weights
each gas according to it’s heattrapping quality in carbon dioxide equivalents
and expresses them in metric tons of carbon per capita) - dimension environmental
quality/degradation
| HD(I) | Human Development (Index), combining life expectancy, adult literacy, combined enrollment ratios, and real GDP per capita |
| HDR | Human Development Report, document, published each year by the UNDP |
human development index (HDI) (UNDP, 1994). The index combines life
expectancy, adult literacy rate, combined enrollment, and real GDP.
| IBM | International Business Machines, international manufacturer of computer hard- and software |
| ILO | International Labor Office |
| IMF | International Monetary Fund |
income distribution (Moaddel, 1994. The measure focuses on the share of the top 20percent in total incomes in over 80 countries. Wherever possible, Moaddel’s data were updated by World Bank WDR, 1994, 1995 and 1996)
increase in life expectancy 1960-90 (calculated from UNDP, 1993/94 via a regression procedure, predicting 1990 life expectancy on 1960 life expectancy, and then taking the residuals as growth rates) - dimension redistribution and human development
increase/decrease of fertility rates 1960-90 (UNDP, 1993/94)
inflation 93 (UNDP, 1996)
| LDCs | less developed countries |
| LEX | life expectancy |
life expectancy at birth as an indicator for the quality of past social
policy, 1990 (UNDP, 1993/94 and World Bank, WDR, 1994)
| LN PCI | natural logarithm of per capita income |
| Ln | natural logarithm |
| M. | Imports |
main telephone lines per 100 population (UNDP, 1996)
mean years of schooling of the population aged 25 and > (UNDP, 1993 and 1994)
mezzogiorno ‘South’ (from the Italian language), a term, more and more used to describe a periphery (like the one in Southern Italy)
migration dependency (UNDP, 1993) net worker remittances per GNP/GDP at the beginning of the 1990s
military expenditures per GDP (UNDP, 1996)
MNC penetration index: penetration by transnational capital, weighted
by population and capital stock, mid-1970s (Bornschier/Heintz, 1979, based
on OECD)
| MNC | Multinational Corporations |
| N | sample size |
| NAFTA | North American Free Trade Area |
| Natl. | natural logarithm |
| NATO | North Atlantic Treaty Organization |
| NOX | nitrogen |
| O2 | oxygen |
| OECD | Organization of Economic Co-operation and Development |
| PCI | per-capita-income |
percent labor force participation ratio (UNDP, 1996)
percent of the labor force in agriculture (UNDP, 1996; Fischer Weltalmanach, 1996)
percent of the labor force in industry (see: labor force agriculture)
| p | number p (3.14...) |
population density total number of inhabitants, divided by the surface
area of a country. Due to the skewness of the indicator, the squared root
(population density^.50) had to be taken (calculated from UNDP, 1993/94)
| PPP | Purchasing power parity |
| PSL | Polish Peasant Party |
| R2 | total variance explained |
| RGP | Linear standard regression procedure of the EXCEL 5.0 program |
| RKP | non-linear standard regression procedure of the EXCEL 5.0 program |
| Rpp | real purchasing power parity |
| S.J. | Jesuits Fathers (Catholic Church) |
| SO2 | sulfur-dioxide |
social security benefits expenditure as percent of GDP in the era of the evolving contemporary Kondratieff cycle, 1985-90 (UNDP, 1994). Social security benefits expenditures include here the compensations for the loss of income for the sick and the temporarily disabled; payments to the elderly, the permanently disabled and the unemployed; they also include family, maternity and child allowances and the cost of welfare services. The UNDP data collection is based on ILO sources
state sector size (gov. expenditures per GDP; UNDP 1996; Weltalmanach, 1995, 1996; World Resources Institute)
structural heterogeneity (labor force share in agriculture divided by product share of agriculture; see labor force data)
terms of trade index 1987-90 (UNDP, 1994, Weltalmanach, 1994, based
on UN)
| TNC | Transnational Corporations |
| UK | United Kingdom |
| UN ECE | United Nations Economic Commission for Europe |
UN membership years (Weltalmanach, 1996, 1995)
UN(O) United Nations (Organization)
UNDP United Nations Development Program
| UNICEF | United Nations Children's Fund |
| USA | United States of America |
| USSR | former Union of Soviet Socialist Republics |
violation of civil rights, 1991 (Stiftung, 1993/94, based on Freedom House, combining freedom of religion, the press, freedom of assembly and association, freedom of trade unions, the right to property and equality before the law)
violation of political rights index, 1991 (Stiftung, 1993/94, based on Freedom House, combining free elections, role of the elected parliament in political decision making, party competition, protection of minorities)
voivodship Polish province. At present, the country still has 49 voivodships (July 1998), but there is an intensive debate going on how to reform the regional structure, with proposals to reduce their number to 12, 15, or 17.
vulnerability of a nation in terms of the expansion of the new international division of labor, 1990 (share of women in the national labor force) (UNDP, 1993/94)
WDR World Development Report, document, published each year by the World Bank
world political threats to a country, to be measured by the percentage
of armed forces per population. Some neo-liberals maintain that world political
threats increase the growth potential of a nation. Due to the skewness
of the indicator, the natural logarithm ln (MPR+1) has to be taken (calculated
from UNDP, 1993/94; see also: Weede, 1985)
| X | Exports |
| x | independent variable(s) |
| y | dependent variable(s) |
years of membership in the United Nations (coded from Weltalmanach, 1995)
List of Tables
Table 0.1: an Andre Gunder Frankian picture of the transformation process of the CEEC-7 countries
Table 1.1: The 11 - 19 main crisis points in the world system
Table 4.1: The effects of dependency (FDI stock per total GDP in the host countries) and world development - data for the 1980s and beyond
Table 5.1: environmental quality in Eastern Europe and the former USSR in comparison to the US, the UK, France, (West) Germany, Sweden and Austria
Table 6.1: the marginalization of women, social devastation and decay in former communist countries of Central and Eastern Europe in comparison to the European Union countries
Table 6.2: gender empowerment
Table 8.1: the influence of Huntington's index on development performance at the level of world society
Table 8.2: The determination of the Gurr-Index of ethno-political conflict in the periphery and semi-periphery
Table 8.3: economic growth and political rights violations in (ex)communist nations
Table 8.4: unemployment, growth, and inflation in the transformation countries
Table 8.5: the discount rate, the budget deficit, debt ratios, investment penetration and current account balance deficits in East Central Europe
Table 8.6: housing construction in Eastern Europe and the former USSR
Table 8.7: money-laundering and its destructive effects on the national economy:
Table 9.1: The Amin hypothesis about the Latin Americanization of Eastern Europe. Current account balances from 1992 onwards in the region
Table 9.2: the determinants of the 1997 referendum on the constitution
Table 9.3: the 1997 general election in Poland
Table 9.4: the political ecology of foreign capital attraction to the different regions in Poland, 1993
Table 9.5: human development on a regional level in Poland, as being determined by socio-political processes
Table 9.6: The logic of the Kondratieff waves in the world economy since 1756
Table 9.7: hegemonic cycles in the world economy since 1450
Table 9.8: world economic cycles and internal instability in Russia since Iwan the Terrible
Table 9.9: The determinants of economic growth in the transformation countries
Table 9.10: Trade balances and current accounts in Eastern Europe
Table 9.11: towards an age of de-regulation? Bivariate and multivariate analyses
Table 9.12: the determinants of the 1996/97 exchange rate rise or fall
Table 9.13: economic performance in Central and Eastern Europe, 1997:
Table 9.14: stability conditions of Eastern currencies
Table 9.15: the balance of payments constraint on economic growth in the transformation states
Table 10.1a: Global patterns of foreign direct investments, 1975-1995, in billions of $:
Table 10.1b: the absolute real income increase from 1960 to 1990 in the world system
Table 10.2: mobility in the international system
Table 10.3: The Pearson-Bravais-correlations of worker remittances per GDP with variables of economic growth
Table 10.4: International dependency and its effects on growth and adjustment, allowing for the influence of the migration process
List of Graphs
Graph 0.1: The success or failure of the transformation process
Graph 0.2: projections for the real income gap between the accession countries and the EU
Graph 0.3: current account balances in Eastern Europe, 1996 - 1999
Graph 0.4: unemployment in Eastern Europe, 1996 and 1997
Graph 0.5: the long economic cycles in the capitalist world economy, 1740 - 1997
Graph 0.6: economic growth and real earnings growth 1980-92
Graph 0.7: relative GDP per capita income gaps within the European Union and between the European Union and the United States of America (expressed in real 1987 $ at current exchange rates)
Graph 0.8: the determinants of development in 123 countries of the world system with comparable data, 1980s and 1990s
Graph 1.1a: The Amin hypothesis about the Latin Americanization of Eastern Europe. Current account balances from 1992 onwards in the region - projections
Graph 1.1b: Structural dependence of the European East
Graph 1.2: The debt crisis of the world periphery
Graph 1.3: poverty data for the European Union (poverty threshold is 50% or below of average consumer expenditures on a Union-wide level) and the Human Development Index
Graph 3.1: the tendencies of the capitalist world economy towards Kondratieff cycles
Graph 3.2: Kondratieff cycles, based on 9 year moving averages
Graph 5.1: CO2-emissions in the world system (1995)
Graph 5.2 Charles D. Keeling’s data series from Mauna Loa - atmospheric concentrations of greenhouse and ozone-depleting gases, 1959-90, and the trend for the next 60 years
Graph 5.3: CO2 emissions and their growth rates from 1950 onwards
Graph 7.1: theories of development or theories of decay? Purchasing power and social decay in 34 developed western democracies
Graph 8.1: victims of mass murder
Graph 8.2: the Kondratieff cycle and instability in the Weimar Republic of pre-war Germany: the long economic swing and the Nazi vote
Graph 8.3: Weimar - radical right and left
Graph 8.4: Weimar and the end of the liberal center
Graph 8.5: current account balances per GDP, 1997 - 2001
Graph 8.6: the non-linear trade-off between levels of democracy and economic growth in former communism
Graph 8.7: East Central Europe at the hour of boom?
Graph 8.8: Kuznets cycles in the world system, 1756 - 1997
Graph 8.9: Polish unemployment 1996 - 1999
Graph 8.10: Polish employment in 1000 persons from 1950 to 1996
Graph 8.11: real wage rate and labor accidents in the Polish economy, 1985 - 1996
Graph 8.12: current account balances and international reserves in East Central Europe - with and without the outlayers
Graph 8.13: general government share and deficit in Poland, 1992 - 1997, in percent of GDP
Graph 8.14: corruption as a function of overall development - the Human Development Index and the absence of Corruption Index
Graph 9.1: unemployment in Poland - total outflows and outflows to work, 1990-1995
Graph 9.2: MNC investments in the Polish economy
Graph 9.3: unemployment in Poland - regional aspects
Graph 9.4: The regionally constant pattern of voting in Poland - the second round of the presidential elections in 1995 as a determinant of the ‘NO’-vote in the constitutional referendum of May 25th 1997:
Graph 9.5: Voting 1995 and 1997
Graph 9.6: the number of doctors and life expectancy in Poland
Graph 9.7a: current account balances in the capitalist world economy, 1991-98 in % of GDPs
Graph 9.7b: current account balances in the world system, 1996/97, in millions of $
Graph 9.7c: the structure of world trade (in % of total world trade; for the ‘triad’ of Asia, North America, and Europe: percentage of regional per total trade of the ‘triad’ countries)
Graph 9.8: income polarization in world capitalism - 1960 - 1994
Graph 9.9: twin deficits in the newly capitalist countries of Eastern Europe
Graph 9.10: towards an age of de-regulation? Bivariate and multivariate analyses
Graph 9.11: The redistribution effect within integrative units. EU12 compared (standard deviations of Human Development Indices in the trade blocks by 1980 are set at 100 each)
Graph 9.12: The absolute values of the average Human Development Indices and their standard deviations in each trade block since 1980
Graph 9.13: Unemployment is a waste of resources
Graph 9.14: International reserves of 20 narco states and 10 leading western democracies
Graph 9.15: The share of narco states in international reserves of the main world financial centers
Graph 9.16: currency reserves and current account balances since 1990 in the world system - Germany, Japan and the USA compared
Graph 9.17: unemployment, labor force participation rate and inflation in developed capitalism
Graph 9.18: European current account balances by international comparison
Graph 9.19: trade-weighted exchange rates since 1990
Graph 9.20: The projected rise of the $ and the fall of major currencies
Graph 9.21: growth, consumer price rises (1997 in %) and changes in the trade-weighted exchange rate, 1996/97
Graph 9.22: $ and Sterling - superstars 1998. Predicted exchange rate dynamics, 1998 in %
Graph 9.23: stability criteria and economic performance in the transformation countries
Graph 9.24: unemployment and inflation - the evidence from Eastern Europe and the former USSR
Graph 9.25: reserves and current account balances in the world system
Graph 9.26: ‘excess reserves’ (money-laundering) and inflation
Graph 9.27: towards a resumption of the arms exporting mechanisms in Eastern Europe? - The Polish case re-considered
Graph 10.1a: shares in world GDP, 1960 - 1994
Graph 10.1b: world trade between the major power blocs
Graph 10.2a: the share of outward foreign direct investment stock in gross domestic product from 1980 - 1994 of major economic power groups in the world system
Graph 10.2b: inequality from 1960 onwards in the world system
Graph 10.2c: The future of world inequality
Graph 10.3: inequality measures and economic growth
Graph 10.4: aspects of international income distribution, 1960-1990
Graph 10.5: Arrighi’s hypothesis of the constancy of international inequality
Graph 10.6: migration, economic growth, inequality, the greenhouse-index and human development
Graph 10.7: migration balances and the Kondratieff cycle
Graph 10.8: the trade-off between migration and human development in 49 Polish voivodships
Graph 10.9: migration propensity and development on a world scale
Graph 10.10: human development in migration societies
List of maps
Map 0.1: income inequality in the world system
Map 0.2: capitalism and inequality growth/decline in the world system
Map 0.3: human rights violations in the world system
Map 0.4: international narcotics control priority areas
Map 1.1: economic growth in the world system since 1980
Map 5.1: defoliation in Central and Northern Europe’s forests
Map 5.2: internal renewable water resources per capita
Map 8.1: The European Union - 2008
Map 8.2: Huntington’s border of the EU, 2008
Map 8.3: ethno-political conflict in the world system
Map 8.4: unemployment in Europe
Map 9.1: current account balance in the world system
Map 9.1: The urban bias of world development
Map 10.1: human development in Europe before EU accession processes
Map 10.2: demographic pressure and future migration trends in the 21st Century
Map 10.3: migration pressure and the Schengen accords
Map 10.4: the breakdown of the Schengen system, 2010?
Foreword (1)
This study is the outcome of my empirical research on the development and decay tendencies of the capitalist world economy since the early 1980s and the role, that Europe will play in these constellations. In a way, it continues the socio-liberal re-reading of dependency theory, presented in ‘Towards a Socio-Liberal Theory of World Development’, published together with Fred Prager in 1993 with Macmillan and Saint Martin’s Press.
Over these years I came to the conclusion that the logic of capitalist world development changes with the ups and downs of longer Kondratieff cycles, and that different periods of hegemony and of world political constellations, connected with these Kondratieff cycles, in turn give rise to different constellations of world economic ascent and decline.
I owe a lot to Samir Amin, Giovanni Arrighi, Chris Chase Dunn, Luigi Scandella and Jadwiga Staniszkis, who helped me with their contributions to further advance the theoretical viewpoints presented here. At the same time, the issue of transnational integration and tendencies for national disintegration, so clearly presented by Osvaldo Sunkel over a quarter of a century ago, emerged with full force during the last years. My above mentioned Macmillan publication (1993) in many ways is more optimistic than the present text, written under the impression of growing regional conflicts, environmental decay, and unfettered globalization, that brought even the Asian success story to its knees.
I hope that this electronic publication serves as an invitation to concerned scholars around the world to further develop the empirical argument, presented in this text. My colleagues both in the academic world and in Government, both in Austria, in Poland, and in Austria’s EU partner countries, deserve more than a passing mention. I also thank my assistant, Joana Godlewska M.A., for her dedicated work during these years here in Warsaw. The Vienna Institute for International Economic Comparisons has provided me with valuable materials and discussion inputs. Their analyses were always clear and concise, and more often than not against the mainstream. Final thanks go to Chris Chase-Dunn from John Hopkins University for the final stages of the preparation and acceptance of this manuscript.
Finally, I’d like to thank my family for their support and understanding. My beloved mother, mother in law and father in law, all born at a time of world political and economic hardship, had to experience in their own lives the consequences of the depressions of the long economic and world political cycles. My deep interest in long cycles is partly determined by the look back on their lives: their childhood in part was the First World War, later on they experienced how the savings of their parents were wiped out during the world inflation of the 1920s, to be followed by the Great Depression, dictatorship and the Second World War. The immediate postwar periods both in Poland and Austria were difficult times as well. The prosperity of the 1950s to the 1970s (in Poland rather shorter) were the days of my youth. These happy years of optimism and trust are over. The world slides slowly from the end of the Cold War to the crescendo of new and perhaps even more devastating conflicts. My mother and my in-laws kept - during the times of the dictators here in Europe - their faith when others quite willingly joined the ranks of Caesar’s. In such a difficult time, they perhaps remembered the verse: ‘et portae inferi non praevalebunt adversus eam’ (and the gates of hell shall not prevail against it) (St. Matthew, 16.18). Now, that they all have left us, I’d like to mention them in deep gratitude and loving memory. Times have changed, and with all these waning orders around us, it is good to remember Saint Matthew’s words.
Warsaw and Salzburg,
August 1998
Foreword (2) and Executive Summary
A few words for the decision makers and the scientists alike at the beginning. Almost 20 years ago I wrote a book (actually my first one), that was entitled ‘Poverty and Dependence. Politics and Economics in Periphery Capitalism (1979)’. I mention this, because a certain distance and critique of development aid was connected with dependency theory. We are about to re-invent the wheel nowadays in Eastern and Central Europe, and all too often, what was learnt in Africa, Asia, and Latin America in the 1960s, 1970s, and 1980s, is now forgotten here in this region. In my 1979 book, I came to a fairly bleak picture of the realities of what was then termed to be ‘dependent accumulation’ in Africa, Asia, and Latin America. Unfortunately, I had to return to this perspective. The new realities, which shape the world after the fall of Communism in 1989, forcefully remind me to a good part of these early studies on periphery capitalism.
The present book, the outcome of my analytical work over the last 5 years, owes a lot to debates about the capitalist world system, that were carried out in the 1980s and 1990s. The transformation depression - or call it ‘the process of creative destruction’ - was so severe, that only Poland had a higher real GDP in 1997 than back in 1989, as the following graph tries to show:
Graph 0.1: The success or failure of the transformation process
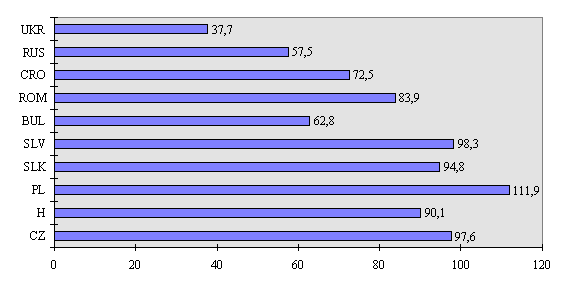
Legend: our own compilations from Podkaminer, et al., 1998. East European GDP 1997 in percent of East European GDP in 1989 in real terms
In reality, there is no catching-up process of the European East with the countries of the Western part of the continent, while some of the net contributors to the European Union budget, like Austria, threaten also to fall below the EU average in the long run and thus will be caught in the same relative downward spiral of dependent capitalism the further you move eastwards on the European continent, away from the Atlantic:
Graph 0.2: projections for the real income gap between the accession countries and the EU
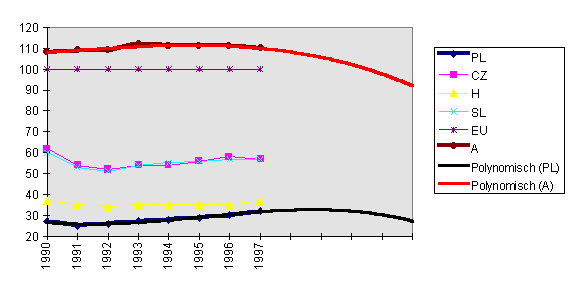
Legend: our own trend-line projections from Podkaminer et al., 1998. Real income projections of various European regions in percent of the EU average
Should there be a repetition of the East Asian crisis of fall 1997 in the region (which I am afraid will happen), even the small progress of the last couple of years would be wiped out again, and the region would be further plunged down, yet another abyss.
It is the simultaneous occurrence of the transformation process, European monetary union, eastward extension, globalization, structural reform of the Union, all at the same time, which calls for a systematic and long-term perspective which is empirically valid, politically feasible and conceptually forward-looking.
When I was still a ‘pure scientist’, I perhaps did not realize the pressure of having to ascertain in some way or the other the medium-term future and the possible counter-measures that governments have to take. Now, having become one these ‘Eurocrats’ (in this case, ‘eurocrat’ for one of the 15 member governments of the Union), I realize how important it is, even at the risk of error, to try to foresee the medium-term future of the world economy and its effects on Eastern and the rest of Europe.
Despite all the progress towards a civil society, towards market reforms, and above all, towards democracy, dark clouds hang again over the horizons, here and there, that should be seriously watched indeed. In addition to Eastern Europe’s long-standing debt-problem, post-transformation current account balances in percent of the GDP, as well as overall trade balances (in $ bn) point again in a downward direction, in a way resembling the 1970s in the region. The main external balances for the CEEC-7 countries (Czech Republic, Hungary, Poland, the Slovak Republic, Slovenia, Bulgaria, Romania) are:
Table 0.1: an Andre Gunder Frankian picture of the transformation process
of the CEEC-7 countries
| CEEC-7 TRADE BALANCE | GROSS DEBT | CURR ACCOUNT BALANCE | |
| 1994 | -10,482 | ||
| 1995 | -16,299 | ||
| 1996 | -28,628 | -3,70% | |
| 1997 | -28,53 | -4,10% | |
| 1998 | -31,45 | -4,80% | |
| Total | -115,389 | 116,9 |
If world-wide social science could learn something from the work of the Egyptian social scientist Samir Amin, it is the critical consciousness of the relevance of the current account balance as the main indicator of the external - or if you wish - ‘dependency’ situation of a country. The Vienna Institute for International Economic Studies projects the following ratios of the current account balances per GDP in the transformation countries:
Graph 0.3: current account balances in Eastern Europe, 1996 - 1999
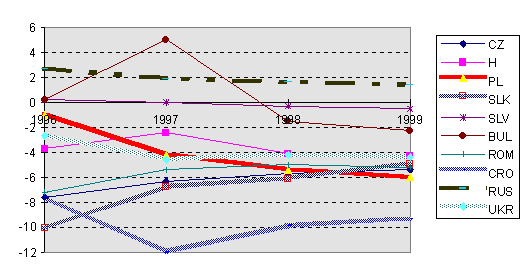
Legend: our own compilations from Podkaminer, et al., 1998. Current account balances in percent of GDP in the different countries of East Central Europe
The problems are huge, not to say overwhelming, especially when we also consider the amount of unemployment, that was created by the transformation process. In some countries, unemployment decreased, while in others, it even increased over time (on the Balkans, in the Czech Republic and in the Ukraine):
Graph 0.4: unemployment in Eastern Europe, 1996 and 1997
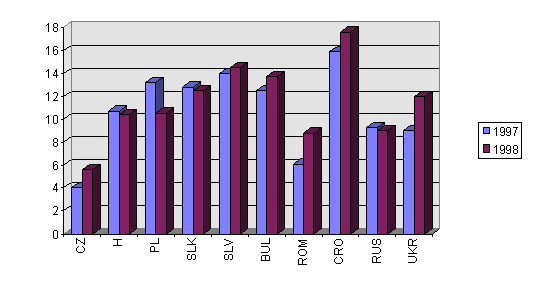
Legend: our own compilations from Podkaminer et al., 1998 and Business Central Europe, March 1998. Unemployment rates in the different countries of East Central Europe in percent of the total workforce (labor market service data)
A systematic application of our contemporary and empirically testable knowledge to the basic issues of European integration is, I feel, more necessary than ever before. After the end of the Cold War, a good part of world-systems oriented research, as the main body of knowledge today, that deals with the future perspectives of the world system, turned to historic and long-term aspects of the evolution, the rise and fall of empires and earlier civilizations, with an unspoken question in mind: what will happen to the contemporary Rome, the United States, the last remaining superpower, whose hegemony is now based, more than ever before, on the power of electronics, communication, information mobility, and the production - and monopolization - of knowledge. Authors like Christopher Chase-Dunn and Andre Gunder Frank have taught us all over the last years important insights into the structure, the rise and decline of major civilizations. Keeping in mind all these important questions of the future of the waning capitalist civilization (Schumpeter perhaps more forcefully than even Marx believed in the waning of capitalism), the question-writing, and thus the plan for this book, was oriented towards the present and future role of Europe in the whole set-up. And yet, considering the European malaise, America’s hegemony will still last for quite some time (let me risk the prediction: a Kondratieff cycle), while Europe’s peripherization will increase. The task of European Monetary Union and eastward extension of the European Union could not come at a worse time. Long-term evidence, based largely on Goldstein’s data series (see Chapter 3) suggests that the world economy is characterized by very strong cyclical fluctuations of the Kuznets type (18-22 year fluctuations) and Kondratieff type (40-60 year fluctuations), and that by around 2004 or 2005, at the latest, we will have quite a strong recession in Europe again, while the first years of European Monetary Union will be characterized by considerable capital inflows:
Graph 0.5: the long economic cycles in the capitalist world economy, 1740 - 1997
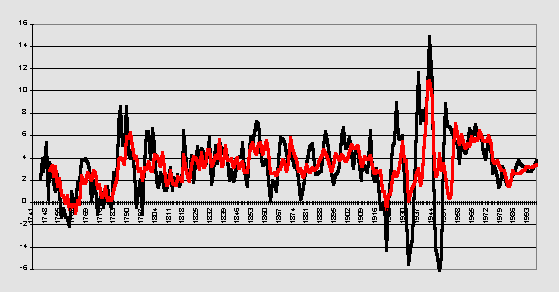
Legend: estimates about the economic growth rates in the capitalist world system from 1740 onwards, based on 5 and 10-year moving averages, calculated from Goldstein’s data, augmented by data from the IMF, the UN ECE, IFRI and the World Bank for the post-1975 period; see Chapter 3 for the details
We use the macro-quantitative method of studying the conditions for the rise and fall of nations to arrive at our conclusions, based on the systematic study of development in the post-1980s. The choice of the time period is not arbitrary: we believe, that transnational capitalism is a cyclical process, and that in the post-1980s years, new social patterns for the rise and decline of nations have emerged, that need to be studied.
In Chapter 1 we outline present-day tendencies of globalization, and come to the conclusion, that a growing proportion of the people of our globe are faced by economic, social, personal, and ecological insecurity. In Chapter 2 we present an outline of the major theories that explain the rise and decline of nations: the world-system/dependency model, the socio-liberal reform model, and the neo-liberal model. Chapter 3 presents the methods of this study, both in a cross-national as well as in a time-series, cycle-oriented sense. The major ideas about the interdisciplinary nature of the development concept, and the development functions used in this study, are presented, as well as evidence about the cyclical fluctuations, that force us to make a particular choice of the time period used. The end-result of our methodological exercise is also a qualification of the old debate about the historical nature of social science: each cycle (Kondratieff cycles of about 40-60 years duration) has its own ‘laws’ of development, and macroquantitative results about, say, the presumed causes of rapid social development or stagnation in the late 1960s, the 1970s and very early 1980s correspond to another logic (a B-phase in the Kondratieff cycle), than, say, results about post-war development from 1945 to 1965 (the A-phase of the ‘fordist’ cycle from, say, 1932 - 1982) or results from 1980 onwards (the A-phase of the present new cycle of flexible specialization), or results from, say, the 1880s to 1914 (the A-phase of the ‘enlargement of participation’ cycle). Our ideas coincide here with those of Samir Amin, Giovanni Arrighi, and Volker Bornschier. Since development is a multidimensional process, we study in Chapter 4 (Chapter 9, Chapter 10) the conditions for the rise and decline of 123 (134) nations on up to 19 indicators of development, that range from the traditional concept of economic growth to social, ecological, and political security. It is shown that TNC penetration (UNCTAD-concept of FDI per GDP) is again one of the main long-term stumbling blocs for development, short-term spurts of growth notwithstanding. Yet there are important qualifying processes that intervene here - the early or late rise of a country to nationhood, and thus - the position in the international system, that very much works like a ‘distribution coalition’, and also the relative achievements of feminism over the last decades, which are threatened to be wiped out with a vengeance by the new and latest phases of global capitalism. Chapter 5 and 6 qualify our results on the ecological dimension and further highlight the tendency of global capitalism to produce a sexist pattern of inequality on a global scale. Chapter 7 is dedicated to the philosophical dimensions of our notion of ‘development’ - as a follow-up to the preceding two Chapters.
Chapter 8 takes up the challenge of Huntington’s counter-model of development in the 1980s and beyond, that is based on the concept of the evolving threat of a ‘clash of civilizations’. We can show, that - if anything - there should be a link-up between those, thriving for a sustainable future in the ‘West’ and those in the Islamic and Orthodox world, who care for the environment. Under proper consideration of the factors of globalization, Islamic or Orthodox cultures are not an impediment to development.
Chapter 9, - the main Chapter of this work in terms of political conclusions - offers what I call a ‘labor perspective’ on European integration. It analyses the continued trend towards peripherization in East Central Europe, it offers detailed results about these trends from a variety of studies on Poland in a regional perspective as well as from the transformation countries in general, and it shows the limits of the process of European integration. OECD country stagnation, depressingly enough, is caused by three factors - democratic age, state sector expenditures, and years of membership in the European Union. Precisely because of that, the Union needs again and again extensions, that only partially can remedy her in-built fundamental weaknesses.
In Chapter 10, we finally offer a pessimistic picture on international mobility and the process of migration, that is part and parcel of what Samir Amin called ‘the five pillars of international inequality’.
Not that you believe, that this book is Euro-centric: again and again, it being attempted to show, how the forces of global capitalism structure nowadays European realities. What has been Osvaldo Sunkel’s prediction more than 25 years ago?
‘...The advancement of modernization introduces, so to speak, a wedge along the area dividing the integrated from the segregated segments (...) The effects of the disintegration of each social class has important consequences for social mobility. The marginalized entrepreneur will probably add to the ranks of small or artesanal manufacture, or will abandon independent activity and become a middle class employee. The marginalized sectors of the middle class will probably form a group of frustrated lower middle class people trying to maintain middle class appearance without much possibility of upward mobility and terrorized by the danger of proletarization. The marginalized workers will surely add to the ranks of absolute marginality, where, as in the lower middle class, growing pools of resentment and frustration of considerable demographic dimension will accumulate (...) Finally, it is very probable that an international mobility will correspond to the internal mobility, particularly between the internationalized sectors (...) The process of social disintegration which has been outlined here probably also affects the social institutions which provide the bases of the different social groups and through which they express themselves. Similar tendencies to the ones described for the global society are, therefore, probably also to be found within the state, church, armed forces, political parties with a relatively wide popular base, the universities etc.’ (Sunkel, 1972: 18-42).
More than 25 years after Sunkel’s essay about transnational integration and national disintegration, parts of the periphery might be underway towards a partial redistribution and a partial re-integration of their marginal sectors, while polarization increases in Europe. This generalized hypothesis is also supported by our analysis of employment data, which, limited as they are, show, that while the South( especially Latin America, South Asia) made at least some headway, parts of the ‘North’ (and that, as usual, includes the very ‘down under South’ of Australia, New Zealand, and partially also Argentina, as correctly predicted by Wheelwright and his school a quarter of a century ago) has declined. Thus, our predictions are again not too far from those of Samir Amin (1997):
Map 0.1: income inequality in the world system
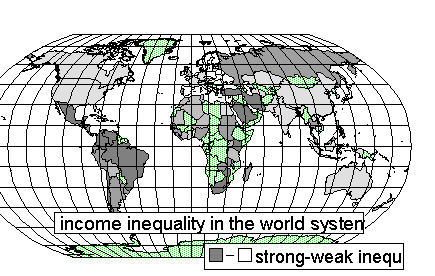
Legend: EXCEL 7.0 graph from World Bank WDR 1996 data (Table 5) and Moaddel, 1994. The darker, the higher the income inequality rates
Map 0.2: capitalism and inequality growth/decline in the world system
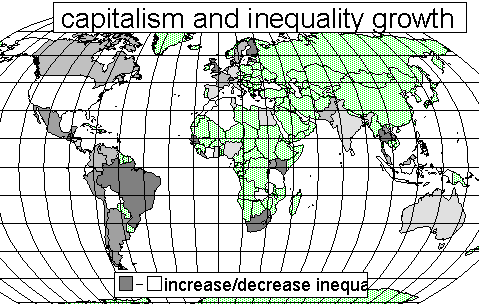
Legend: income distribution changes as measured by the 10 year standardized growth/decline in the share of the top 20% in total incomes. Calculated from World Bank, WDR, 1996 and Moaddel, 1994, using EXCEL 7.0. The darker, the higher income inequality growth
The real basis of rising inequality in the capitalist world system is the fact, that globalization changed the power relationships between capital and labor to a dramatic extent. For every increment of 1% to the GNP of the countries of the world per year, there is only an annual increment of 0.63% to the real earnings of dependent labor throughout the period 1980-92/93. Our following Graph shows these latest available UNDP statistics on economic growth and real earnings growth, 1980-92/93 p.a.:
Graph 0.6: economic growth and real earnings growth, 1980-92/93
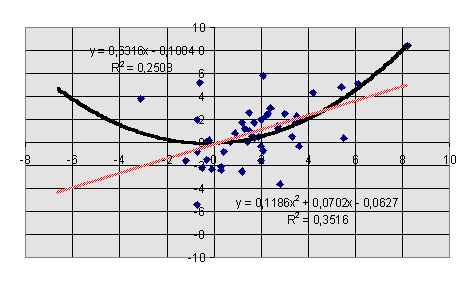
Legend: our own compilations from UNDP, Human Development Report, 1996. For the choice of countries, see sample Chapter 10 (n = 134 nations). X-axis: economic growth 1980-93 p.a.; y-axis: real earnings growth during the same period p.a.
There is mounting evidence, focused on in this book, about the limits of the process of European integration as a strategy of world economic ascent. Euro-optimists, like professor Werner Weidenfeld in his recent article in Neue Zuercher Zeitung (10.07.1998), maintain that the Union will soon comprise every 7th state in the world, that the Union is about to crown its success of its internal market with European monetary union, and the Union concentrates within its borders around half of world trade and ¼ of world product. Half a billion (500 million) inhabitants will share among each other the fruits of the integration process. Our view, developed in Chapter 9 of this book, is much more somber: while it is true, that the Union could re-distribute between its center and its periphery between 1960 and 1994, this process will practically come to a halt with European monetary union and eastward expansion. And Europe again falls behind, at least in relative terms, to other capitalist centers, like the United States of America, due to a process of the becoming ‘South’, a partial mezzogiorno-zation, of the whole of Europe. Connected with it is the rise of the shadow economy, distribution coalitions, organized crime and spread of the Mediterranean criminal transnational corporations to the whole of Europe:
Graph 0.7: relative GDP per capita income gaps within the European Union and between the European Union and the United States of America (expressed in real 1987 $ at current exchange rates)
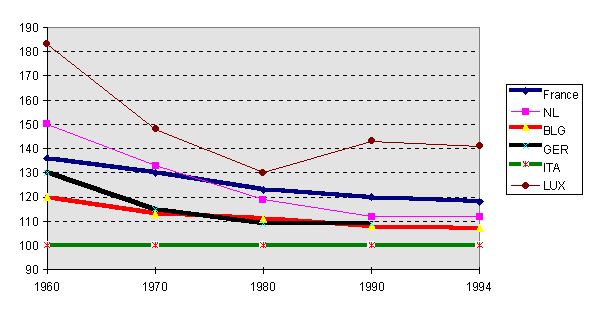
Legend: real GDP per capita of the founding members of the European
Union in percent of the Italian GDP per capita for 1960, 1970, 1980,
1990, and 1994. In the 1950s, Italy was by far the poorest country of the
Union. Our data are from UNDP, Human Development Report, 1997. They refer
to the UNDP data series on GDP per capita in 1987 real $ since 1960, and
were calculated from the original tables for the purpose of this book.
The empirical values for the above graphical presentation are:
|
1960
|
1970
|
1980
|
1990
|
1994
|
|
| France |
136
|
130
|
123
|
120
|
118
|
| NL |
150
|
133
|
119
|
112
|
112
|
| BLG |
120
|
113
|
111
|
108
|
107
|
| GER |
130
|
115
|
109
|
109
|
|
| ITA |
100
|
100
|
100
|
100
|
100
|
| LUX |
183
|
148
|
130
|
143
|
141
|
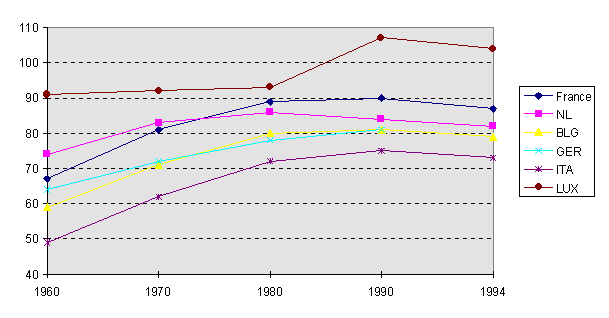
Legend: real GDP per capita of the founding members of the European
Union in percent of the US GDP per capita for 1960, 1970, 1980,
1990, and 1994. Our data are from UNDP, Human Development Report, 1997.
They refer to the UNDP data series on GDP per capita in 1987 real $ since
1960, and were calculated from the original tables for the purpose of this
book. The empirical values for the above graphical presentation are:
|
1960
|
1970
|
1980
|
1990
|
1994
|
|
| France |
67
|
81
|
89
|
90
|
87
|
| NL |
74
|
83
|
86
|
84
|
82
|
| BLG |
59
|
71
|
80
|
81
|
79
|
| GER |
64
|
72
|
78
|
81
|
|
| ITA |
49
|
62
|
72
|
75
|
73
|
| LUX |
91
|
92
|
93
|
107
|
104
|
| USA |
100
|
100
|
100
|
100
|
100
|
The amount of problems of the Italian mezzogiorno, in particular, are truly staggering: among its 21 million inhabitants, unemployment among the young is now approaching 50 percent. Fewer than a quarter of the young people between the age of 15 and 29 are in the official workforce. Ever since Italy was united and monetary union between the North and the South was introduced, unity concealed diversity. Rampant poverty, crime and corruption, but also the heroic attempts of the local population to continue living under such strenuous circumstances, characterize the scene. The 182 km Palermo-Messina highway took more than 20 years to build, and 50 kilometers are still unfinished, the final viaduct half-ready for perhaps eternity. In Porto Empedocle, the government poured millions into a gigantic chemical plant, that never started work. The new Catania hospital was never opened, the swimming pool in Nuoro in Sardinia was closed down soon after opening (The European, 426, 20-26 July 1998, p. 8-12). The bizzo, the protection money, paid by the majority of enterprises to the large transnational criminal enterprises, is but the tip of the iceberg of market distortions and economic waste.
There is a partially optimistic, and a partially pessimistic implication
for the transformation countries of Eastern and Central Europe. They can
be optimistic, because a host of societal problems definitively becomes
easier after the ‘turning points’, expressed in terms of already achieved
human development levels. Most of the reform countries are well beyond
these ‘crisis points’, and for that reason alone, the European center
cannot close its frontiers to the East. The ‘turning points’ for these
problems are:
| adjustment problems in the world economy | 0.5 |
| avoiding deforestation | 0.75 |
| avoiding destabilization and wars | 0.425 |
| avoiding ethno-warfare | practically linear |
| civil rights performance | 0.3 |
| controlling refugee inflows | 0.5 |
| gender development | practically linear |
| gender empowerment | 0.7 |
| general life expectancy | practically linear |
| growth potential | 0.4 |
| income redistribution | 0.5 |
| maternal mortality reduction | practically linear |
| political rights performance | 0.2 |
| poverty reduction | practically linear |
| protection of the national forest area | 0.9 |
| reducing corruption | 0.55 |
divorce rates increase in a linear fashion
drug crimes grow exponentially
green house emissions increase after 0.5 HDI
homicides grow practically in a linear fashion
increases in life expectancy diminish after 0.4 HDI
municipal waste increases in a strong way
prisoners per population increase after 25000 $ PPP income
rape increases strongly after 20000 $ PPP income
road accidents increase dramatically after 22000 $ PPP income
suicide (male and female) increase in a linear fashion
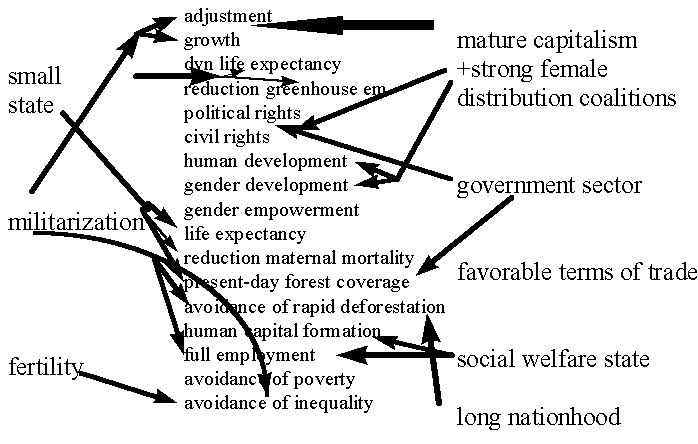
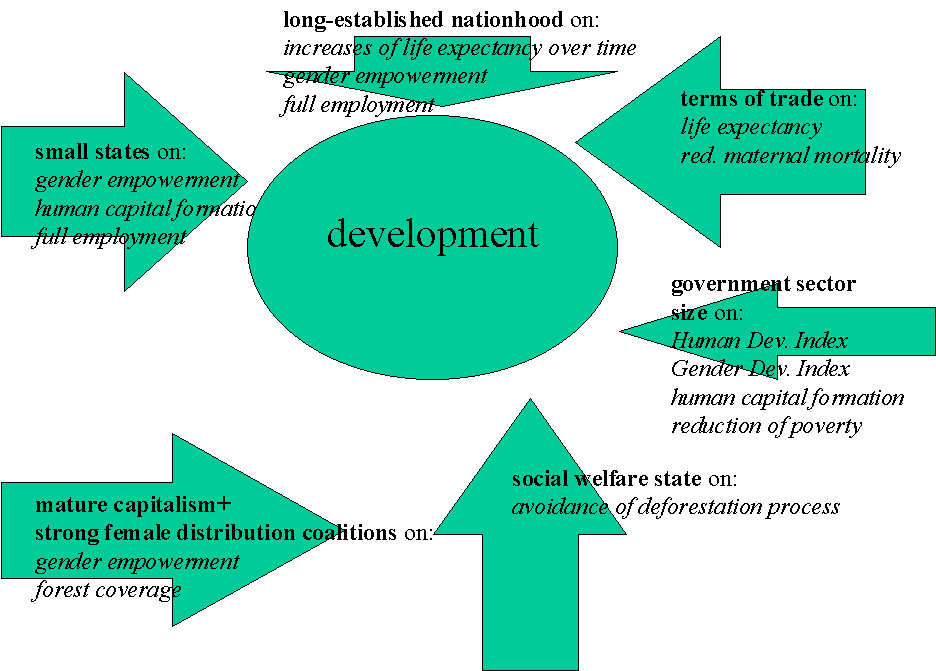
These are the tramps of capitalist post-industrial civilization as such. Peripheries and semi-peripheries in addition are threatened by unequal exchange and unequal specialization in the international division of labor. In some stagnant societies, strong wage labor organizations could - temporarily - prevent real earnings from falling, but these victories are short-lived and often at the price of long-run stagnation and inflation. Graph 0.8 now shows the influences of socio-economic variables on development in the 1980s and the 1990s: global capitalism increases the internal contradictions in the world system, and indeed, there is a process of transnational integration and national disintegration:
Graph 0.8: the determinants of development in 123 countries of the world system with comparable data, 1980s and 1990s
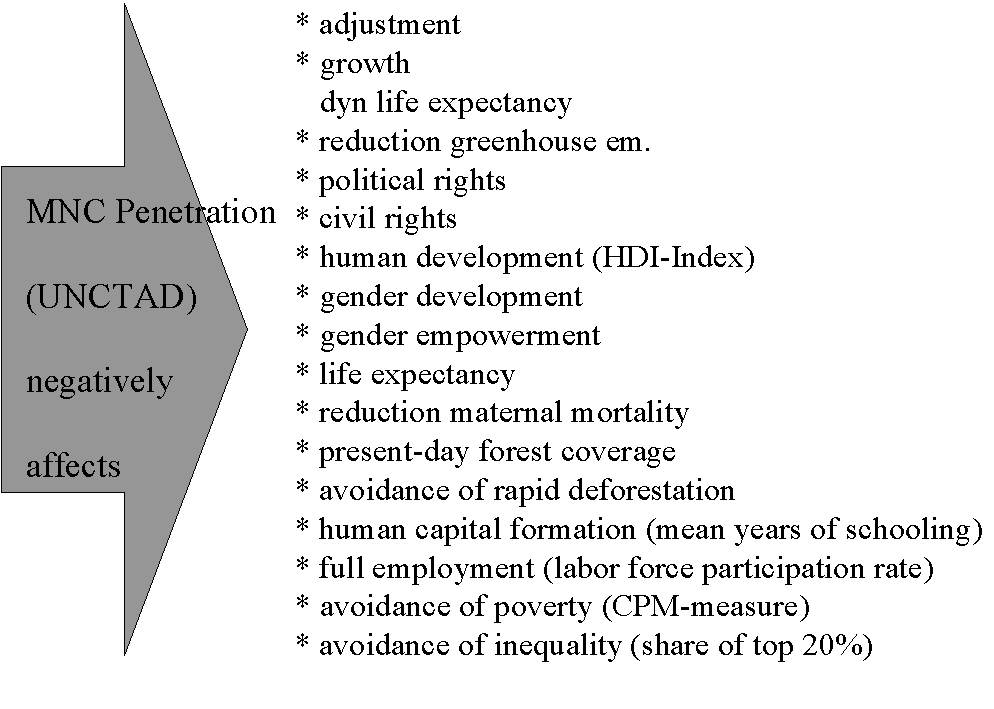
Legend: see Table 4.1, Chapter 4. The graph symbolizes the empirical results of Table 4.1 (significant predictors in multiple regressions), keeping initial development levels (and sometimes also: agricultural area) constant.
Only MNC penetration influence on life expectancy increases over time is not significant at the 5% level; but long-established nationhood, another dependency indicator (Amin, 1997), takes over the effect of MNC penetration, which is still significantly and negatively affecting life expectancy increases, even in this equation. In addition, militarization is another very significant predictor
b) other negative influences
Legend: the determination coefficients (R^2) of the main
empirical results of this study are the following:
| human capital formation | 88 |
| gender development | 87,1 |
| human development | 87 |
| gender empowerment | 82,2 |
| life expectancy | 77,4 |
| dyn life expectancy over time | 75,7 |
| maternal mortality rates | 72,3 |
| CPM-poverty measure | 65,1 |
| civil rights violations | 60,1 |
| political rights violations | 56,8 |
| employment (LFPR) | 55,1 |
| economic growth | 44,2 |
| greenhouse gas emissions | 42,4 |
| adjustment (see Chapter 3) | 37,8 |
| annual deforestation rate | 34,5 |
| forest coverage | 30,3 |
| share of top 20% in total incomes | 25,2 |
These contradictory tendencies are to blame for what we fear will be the long-run and slow erosion of the international order, that is characterized by the cycles, so aptly described by Joshua Goldstein, now already 10 years ago (Goldstein, 1988; see also: Chapter 3). The partial re-peripherization of the ‘North’ and ‘far South’ is accompanied by partial increases in human rights violations and more exclusive patterns of government in these former zones of prosperity in the world system. The ‘Southernization’ of the ‘North’ in the economic sphere is partially accompanied by ‘southernization’ in the political sphere. Suffice to say here, that in Europe we experienced the largest civil rights violations since the Second World War, and that unemployment in Germany now reaches Weimar proportions (10.9%; IFRI, 1998).
Map 0.3: human rights violations in the world system
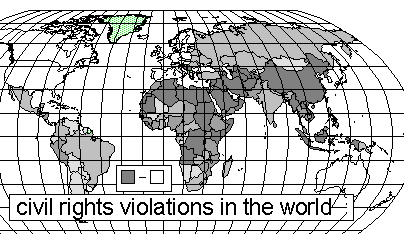
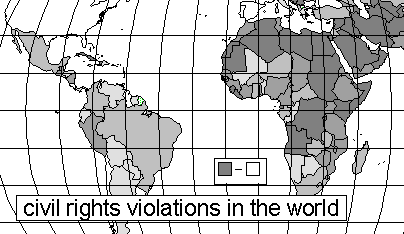
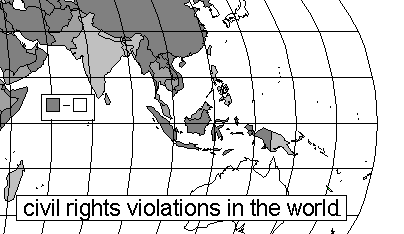
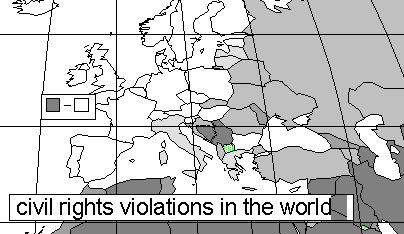
Legend: our own compilations from Freedom House Sources/Stiftung Entwicklung und Frieden, 1996, and EXCEL 7.0 map system. The darker, the more severe human/civil rights violations are
At the same time, the narco-economy establishes itself as the most dynamic core of world capitalism; in effect threatening the very existence of ‘civil society’:
Map 0.4: international narcotics control priority areas
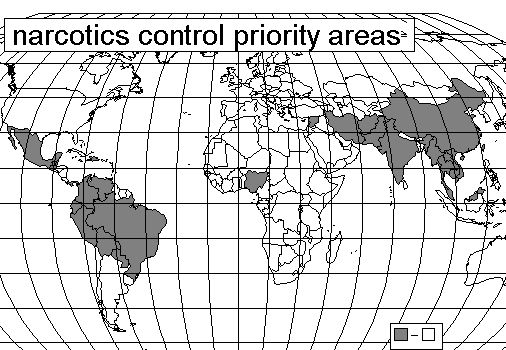
Source: EXCEL 7.0 map on the basis of US Department of State (1996), ‘International Narcotics Control Strategy Report’, March. The dark regions in our Map are the US Dep of State Drug Control priority areas.
Europe thus faces three very important decisions about the future: east-ward expansion of the European Union, European monetary union, and the structural internal reform of the Union. Faced with these decisions, an intellectual battle rages across the continent between euro-skeptics and integrationists, between federalists and nationalists, between centralists and regionalists. World systems research and development research provides radical, fascinating and novel answers to these old controversies. What is the evidence of cross-national quantitative research?
Political disintegration will go hand in hand with economic disintegration. The realities of semi-periphery and periphery capitalism are, that dependency and market imperfections interact. Thus many of the past controversies between dependency theory and neoclassical economics are simply futile and rather a question of language and not of substance. Take again the example of Central and Eastern Europe. Official current accounts in 1996 show for the Czech Republic, Hungary, Poland, Slovenia, Albania, Bulgaria and Romania a balance of minus -10,395 $ billion (Warsaw Voice, April 20, 1997: 12). The East European new democracies are on their way towards ‘Latinamericanization’ - viz. towards rising debts and negative current account balances. Call it tequila effect, caipirinha effect or what you like - the negative current account balances are there again with a vengeance. Amin (1997) has maintained, that this will be the most likely outcome of the world economy for the region of East-Central Europe for the next decades. The Maastricht fundamentalism of the up-to-now ruling constellations in Western Europe will make matters worse, while post-communist liberal ‘neo-corporatism’ - like in Poland after 1993 - at least avoided some of the harshest contradictions of neo-liberalism (like in Poland before 1993) or neo-Stalinism (like in Belarus) alike. Chase-Dunn and Hall, 1995, are correct in pointing out the long-term detrimental effects of cultural patterns of dependency in determining a far larger portion of ‘internal’ developments than is suggested by most measures of ‘direct’ dependency. In Poland - as a careful reading of the international press will suggest us -, car imports last year amounted to $4 billion, a fact, that is traditionally hidden in most aggregate statistics published on that country. The trade balance deficit increased from $6.2 billion in 1995 to $12.7 billion in 1996. An entire army of experts assures us that there is no need for concern yet. Amin (1997) correctly pointed out that international development bureaucracies seem to be inclined towards optimistic assessments, when already debt-driven development patterns set in. But the Polish foreign trade deficit for agriculture and food alone came to $1.2 billion, in many ways reflecting the advancement of the car + meat culture so popularized in western TV serials. At the same time, a large portion of the population (> ¼) still works in agriculture, and public transport is marginalized by state intervention into the economy. Another structural feature is the difficulty of the Polish economy to sustain a high level of exports. The prevalence of raw materials and partially processed goods in exports contributes to a worsening of the terms of trades. Copper, coal and coke all were cheap - and are being exported to the world market, while Polish state funds are used to maintain that structure - to the detriment of the relative availability of funds for human capital formation, science, health, environmental protection, public transport and technological development, made in Poland. Powerful ‘internal’ workers coalitions coexist and even connive with the state class management to maintain the extractive sector. The inflow of cheap goods from the outside has given unexpected competition to Polish firms, which are driven out from the market. Domestic demand grows much more rapidly than domestic production; indeed, the growth rate of production has dropped from +12.1% to +8.5%. The import absorption of foreign capital, as Warsaw Voice has shown, is also considerable: foreign capital in Poland was responsible for 42.4% of Polish imports, and 70 percent of the negative trade balance (the TNCs in Poland contributed to only 32.4% of exports). The negative trade balance - also a result of the not sufficiently far enough trade liberalization policy of the European Union - will rise to $16 billion in 1997 and even higher in 1998. An insufficient part of the economy - and of course here we disagree with conventional world system theories - is under the discipline of a real market, which is, by the very inflexibility that such a structure creates, a powerful motive to maintain a relatively high exchange rate of the Zloty, favoring easy and cheap imports, thus continuing the downward long-term circle of dependency. But, one might argue, this is the class-relation set-up of semi-peripheral capitalism. In such a synthesis of neoclassical and dependency perspectives of development constraints in a country like Poland, internal inequalities - in Poland mainly regional and sector inequalities - will not be missing. Income distribution data on a global level show (see above and appendix), that large areas of the world are dominated by medium to high inequality, and that inequality decreased in some countries, but increased in others - especially in the former socialist countries after the transformation, in Sub-Saharan Africa, and in industrialized nations themselves. Our estimates about world-wide internal income inequalities are:
Table 0.1 income inequality in the world system (top 20%)
| Canada |
40,2
|
| USA |
41,9
|
| Japan |
37,5
|
| NL |
36,9
|
| NOR |
36,7
|
| SF |
37,6
|
| France |
41,9
|
| Iceland |
44,4
|
| Swed |
36,9
|
| Spain |
36,6
|
| Australia |
42,2
|
| Belgium |
36
|
| Austria |
45,1
|
| NZ |
44,7
|
| CH |
44,6
|
| UK |
44,3
|
| DK |
38,6
|
| GER |
40,3
|
| IRE |
39,4
|
| ITA |
41
|
| GRE |
44,5
|
| ISR |
39,6
|
| LUX |
41,8
|
| MAL |
44
|
| POR |
49,1
|
| HUNG |
36,6
|
| LATV |
36,7
|
| POL |
36,6
|
| RUS |
53,8
|
| BELR |
32,9
|
| BULG |
39,3
|
| EST |
46,3
|
| KAZ |
40,4
|
| ROM |
34,8
|
| UKR |
35,4
|
| LITH |
42,1
|
| ARM |
48,4
|
| UZB |
50,1
|
| AZER |
48,6
|
| KYR |
49,1
|
| GEO |
45,6
|
| ALB |
48,7
|
| TAJ |
50,3
|
| Hong Kong |
47
|
| Cyprus |
44,5
|
| Barbados |
41,9
|
| Bahamas |
49,4
|
| S-Korea |
45,2
|
| Argentina |
45,2
|
| Costa Rica |
50,7
|
| Uruguay |
52,5
|
| Chile |
61
|
| Singapore |
48,9
|
| Trinidad |
50
|
| Bahrein |
51,1
|
| Antigua |
44,8
|
| Panama |
59,8
|
| Venezuela |
58,4
|
| Saint Kitts |
40,4
|
| Fiji |
48,5
|
| Mexico |
55,3
|
| Colombia |
55,8
|
| Thailand |
52,7
|
| Malaysia |
53,7
|
| Mauritius |
47,6
|
| Brazil |
67,5
|
| Seychelles |
47,8
|
| Dominica |
39,2
|
| Belize |
49,4
|
| Algeria |
46,1
|
| Botswana |
50,7
|
| Saint Vincent |
46,3
|
| Suriname |
46,6
|
| Saint Lucia |
46,4
|
| Grenada |
43,4
|
| Tunesia |
46,3
|
| Oman |
50,8
|
| Turkey |
56,5
|
| Paraguay |
50,2
|
| Jamaica |
47,5
|
| Dominican R |
55,7
|
| Sri Lanka |
39,3
|
| Peru |
50,4
|
| Philippines |
47,8
|
| South Africa |
63,3
|
| Indonesia |
40,7
|
| Guyana |
46,4
|
| Egypt |
41,1
|
| Maldives |
49,9
|
| China |
43,9
|
| Swaziland |
50,1
|
| Bolivia |
48,2
|
| Guatemala |
63
|
| Mongolia |
48,9
|
| Honduras |
57,4
|
| El Salvador |
47,8
|
| Namibia |
49,7
|
| Nicaragua |
55,2
|
| Gabon |
50,2
|
| Cape Verde |
48,5
|
| Morocco |
46,3
|
| Zimbabwe |
62,3
|
| Congo |
50
|
| Papua NG |
49
|
| Cameroon |
49,7
|
| Kenya |
62,1
|
| Ghana |
42,2
|
| Lesotho |
60,1
|
| Equatorial G |
46,5
|
| Pakistan |
39,7
|
| India |
42,6
|
| Zambia |
50,4
|
| Nigeria |
49,3
|
| Comoros |
50,3
|
| Togo |
46,8
|
| Bangladesh |
37,9
|
| Tanzania |
45,4
|
| Cote d'Ivoire |
44,1
|
| C African R |
48,8
|
| Mauritania |
46,5
|
| Madagascar |
50
|
| Nepal |
39,5
|
| Rwanda |
39,1
|
| Benin |
49,2
|
| Malawi |
55,2
|
| Guinea-Biss. |
58,9
|
| Gambia |
50,2
|
| Chad |
48,4
|
| Burundi |
48,6
|
| Mozambique |
49
|
| Burkina F. |
48,9
|
| Mali |
49,3
|
| Sierra L. |
54,5
|
| Niger |
44,1
|
| country code | top 20% |
What is the evidence of our cross-national quantitative research?
(i) The process of globalization did not level-off the differences in wealth and well-being between the different regions of the world, especially between Europe and the Mediterranean southern periphery of Europe. Far from granting a real free trade regime, Europe has petrified existing patterns of the division of labor between the centers and the peripheries. Poverty, unemployment, homelessness and other negative social phenomena become more and more relevant, not just for periphery and semi-periphery countries, but for the former centers in Europe themselves. We are evidencing a peripherization of the European landmass, while the countries of the Western Pacific and the Eastern Indian Ocean are the future centers of world capitalist development.
(iv) The eastward expansion of the Union will have to face up to the dilemmas of modernization in the environment of past rapid urbanization (what world system scholars have termed the urban bias in world development), little efficient state-directed mass communication and belated demographic transitions in much of the Balkans and the former Soviet Union, if not the former Warsaw Pact in general. Modernization and structural adjustment in the post-1989 set-up is bound to fail in the East if it is not accompanied by a massive real inflow of foreign resources. The semi-democratization in much of the region, that set in after 1989, is much more dangerous than the full rule of dictatorship or full democracy. Money laundering and fluctuations in the terms of trade are additional important determinants of the growth prospects of the reform countries.
(v) Modernization, globalization, and East-ward expansion of the Union might increase existing cleavages in the countries of the East, if they are not accompanied by a deep structural change in favor of the up to now underprivileged sectors and strata. Many of the lessons of neo-classical economists about Southeast-Asia from 1945 to around 1995 can be repeated here in an East European context. The discrimination against exports by import substitution strategies, effective currency overvaluations, privileges and wage inflexibility in the monopolistic sectors, and finally and overarching all these phenomena, a conspicuous contempt of urban elites against the countryside and a deep urban bias of development have created a structure, where the political and social divisions between the different parts of countries have increased. It is shown in this study with regional multivariate analyses from Polish election data 1993 to 1997, that electoral results are heavily determined by these regional and world economic aspects, while other theories fail to capture the dynamics of socio-political cleavages in the new democracies of the East.
(vi) Euro-sclerosis at the heart of the Union of presently 15 nations is a reality. Take any indicator of economic illness in the relatively stable Western democracies today - unemployment, lack of economic growth, insufficient human development: it will be neatly determined by just three variables:
- age of democracy within world politically guaranteed boundaries
- size of the state sector, like central government expenditures per GDP
- years of membership in the European Union
Instead of causing stable long-term economic growth, the Union rather causes what might be termed ‘the Belgium syndrome’. Relatively young democracies, like Poland or the Czech Republic, Hungary or Slovenia, will still benefit for a few years from the positive effects of early membership; but the positive initial effects will disappear with the workings of the really existing Union in the long run.
So, what then is the prescription? For Arrighi (1995), there seems to emerge the imperative of organizing the international community anew around the axis of the East Asian/North American archipelago, gravely shattered by le crash of fall 1997, implicitly hoping for democratization spin-offs along this axis. Arrighi seems to advance the viewpoint that such a ‘world community’ controlled capitalism would still be better than the rule of chaos and war. This analysis will be of course sharply contended by those who think that Asia’s days have gone. But people as far apart as Andre Gunder Frank and Jeffrey Sachs agree on the hypothesis, that Asia’s recent troubles must be seen in the context of its long-term upsurge. It still might be, that the race towards the EURO rocked the boat in favor of Europe and in disfavor of Asia for a short while; but wait and see: the true high seas for the European common currency boat will be coming only by around 2001, 2002, or 2003, when the effects of the common currency under neo-monetarist conditions will become fully visible.
For us, Europeans, the lectures of the empirical study of contemporary changes in world capitalism are twofold: one is more medium-term, the other long-term: the real empowerment of the European Parliament (‘no taxation without representation’), a full-fledged European Constitution, a European Government, a European more slender and socially just state, European federalism in the member countries, free periphery access to the markets of goods of the center, and also more decisive efforts in human capital formation (in the framework of privatization of Universities and other institutions of higher learning). Thus, only a kind of socio-liberal United States of Europe would be able to overcome the present impasse of the Union. The European Parliament, preferably as a two-chamber system, should have one chamber representing the electorate according to population weight, the other chamber representing the then former member nations of the Union (say, 5 deputies for each member nation). There must be also a European Judiciary, a clear federal structure, a strong subsidiarity down to the smaller entities and regions, and finally, an economic policy, based on a basic social minimum income, a negative income tax, a radical downsizing of all the other state sector influence, and a certain Canadization of migration policy (orderly and limited legal chances of immigration) et cetera.
To learn form the historic East Asian Space-of Flows (Arrighi, 1995) above all suggests that heeding the advice of contemporary economics, learning its lessons from East Asia from 1945 to around 1995 in such areas as corporate strategy, labor market organization, international trade and migration, would be more advantageous than to be trapped again by the fatal conceit of a thinking along the lines of the territorial control, alas by democratic methods this time, a democratic economic space, Lebensraum. And Germany, in particular, at the decisive time, seems to forget that the main imperatives of world system ascent are economic and not territorial - now in the wider, European Union sense. Such advice unheeded, eastward European Union expansion could dismally fail, made all the worse by the negative effects of ongoing Maastricht austerity. Thus the time is ripe for a socio-liberal alternative to orthodox etatism and neo-conservatism alike.
On a long-term basis, though, only a socio-liberal world state will be able to overcome the intrinsic instabilities of the capitalist nation system, that has (un)governed the world since 1450. Today’s problems are too global to be left to a (supra)national state. And at any rate, transnational capitalism rings the bell to all attempts at national regulation for the next 50 or 100 years, and its earth and labor consuming civilization will be doomed as all the other civilizations before it in the rhythm of 250 to 300 years of ascent and decline, from the days of Egypt and Mesopotamia onwards (Chase-Dunn and Hall, 1997).
So, our predictions for Europe are dire: Sunkel’s scenario, at least in part, offers a key to our future. Capitalist globalization can only be answered by global democratization strategy. Whether or not this will be already too late in terms of the environmental destruction, that makes our planet’s future more and more dangerously similar to that of planet Mars’ history, or not, only history can tell.