Migration and globalization
10) Migration and Globalization
A number of authors from the dependency/world system tradition observed dramatic shifts in the location and organization of international production since the mid 1960s. While the traditional division of labor between the center and the periphery implied industrial production in the centers and raw material production in the peripheries, linked to each other via the mechanism of unequal exchange and oligopolistic competition, these structures began to change, the argument of Froebel et al. and Ross goes, in favor of global shifts of the sites and organization of production: the old, classic working class of the centers is ‘substituted’ by a) the re-location of industrial production to the semi-periphery and b) by the massive process of migration of peripheral labor that set in North America and Western Europe since the 1960s. Although there are quite a number of systematic studies on the impact of capital penetration on the host countries in the periphery, the impact of migration on the development process of the sending and recipient countries has been less at the center of attention of world-system and dependency-oriented development research.
Mass migration, as Amin (1997) reminded us, is part and parcel of this process of transnational capitalism. The market economies of western Europe first imported labor; now, with the transfer of production away from the European central zones, second generation foreigners become increasingly marginalized. In the inner cities of countries like France, Germany, and Britain, real ‘ghettos’ develop, a process that began in the United States of America three or two decades ago. Women also have to suffer from these tendencies, as their jobs are being exported away to the still much-lower paid labor power of the periphery and the semi-periphery (Stiftung Entwicklung und Frieden, 1993). Migration is even part of the five pillars of international inequality (Amin, 1997, see also Chapter 9):
Following research contributions, which linked the patterns of international migration to the overall patterns of the center-periphery relationship, we try to develop here some hypotheses. The impact of migration on the sending countries under such conditions will be increasing the patterns of unequal exchange and the peripheral role in the world economy. It might be, that income distribution will become perhaps less unequal under the impact of the absence of millions of unskilled laborers from their home countries, but many other phenomena of peripheral development will be intensified; such as the deficient structures of agriculture, the environmental crisis (due to the intensification of traffic), and - in the end - the dependent character of accumulation, leading to slower economic growth and increased capital imports. World system oriented empirical research on migration confirmed, by and large, such a somber perspective (Amankwaa, 1995; Arrighi/Silver, 1984; Boehning and Schloeter-Paredes, 1994; Elsenhans, 1978; Parnreiter, 1994; Stalker, 1994; Stark and Taylor, 1991; Tausch, 1997).
Semi-peripheral and peripheral decision makers, largely representing the import-dependent, urban elites, - and here there is no basic difference between the Philippines and Poland - demand semi-peripheral or peripheral access to the labor markets of the centers, but they overlook the dire sociological implications of mass migration on the sending countries (Tausch, 1997, with a detailed debate about mainly ILO research). Recent econometric models, reviewed by Breuss (1997), could show that, in the case of EU-recipient countries with relatively high rigidities, immigration leads to higher unemployment, lower wage growth, but also a slightly lower inflation rate. Wage ‘dumping’ indeed is a problem on a European scale, made all the worse by present-day and future dispositions to migrate (see also the empirical survey in Poland, the Czech Republic, Hungary, Slovakia, and Slovenia by the Gallup Institute and the Austrian Academy of Science, reported in Fassmann/Hintermann, 1997). These tendencies could even increase after EU-accession, basically because the problem of millions of small-scale peasants in East-Central Europe is unresolved. Unimpeded competition by high-tech and high-subvention Western agriculture will ruin millions of jobs in the peripheral rural structures of the East (Tausch, 1997).
In the centers, inequality will increase under the impact of mass migration, while at the same time, mass demand and technical progress, the ‘twin engines’ of auto-centered development, will suffer under the impact of the evolution of a 2/3-society in the center countries.
Our dire prediction, based on the systematic study of ‘hard’ data about world development in the 1990s is that there is hardly any ‘mobility’ in the international system; and that in particular, mass migration is not a strategy of ascent for the semi-periphery and periphery. How can we maintain such a hypothesis? Arrighi (1995) indicated, that, the Asian crisis of fall 1997 notwithstanding, the basic movement of the capitalist world economy during the 1980s and 1990s is the geographical shift away from the Atlantic region towards the Pacific. ‘Hard’ data about international capital movements support Arrighi’s hypothesis. Our basic thesis is, that West European capital flows out, partially to Eastern Europe, but also to the United States and the Pacific theater, while the long-term tendency for the balance between outflows and inflows in both North America and Japan decreases, indicating the international productive capital shifts to the Pacific region, the more short-term shifts of the fall 1997 notwithstanding. At the same time, the rise of China as a haven for transnational capital continues. The share in world GDP of the different regions of the world has changed considerably since the 1960s: however, not all changes reflected faster growth; some, like for the European Union, were rather the consequence of enlargement; i.e. integration as a reaction mechanism towards decline. The four blocs were: the European Union, USA, Japan, the remaining OECD countries, and the rest of the world. Our results are:
Graph 10.1a: shares in world GDP, 1960 - 1994
Legend: shares in world GNP. Source: our own calculations from Stiftung Entwicklung und Frieden, 1998: 152. The data for the EXCEL projections were:
|
USA |
EU |
Japan |
other OECD |
Rest |
Total |
|
|
1960 |
43,2 |
16,4 |
3,8 |
11,4 |
25,2 |
100 |
|
1970 |
36,2 |
17,7 |
7,3 |
12,4 |
26,4 |
100 |
|
1980 |
24,9 |
26,2 |
9,8 |
11 |
28,1 |
100 |
|
1985 |
36,3 |
20,8 |
12,2 |
10,4 |
20,3 |
100 |
|
1994 |
25,9 |
26,6 |
17,9 |
7,5 |
22,1 |
100 |
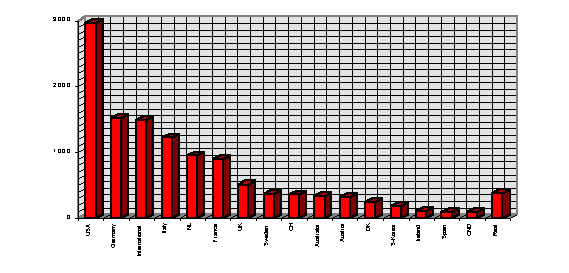
The transnational world-wide market economy has expanded tremendously since the early 1980s. A look at transnational investment flow statistics shows this process in all clarity:
Table 10.1a: Global patterns of foreign direct investments, 1975-1995, in billions of $:
|
OECDinflows |
OECDoutflows |
LDCinflows |
LDCoutflows |
CEEinflows |
CEEoutflows |
|
|
1990 |
169,8 |
222,5 |
33,7 |
17,8 |
0,3 |
0,04 |
|
1991 |
114 |
201,9 |
41,3 |
8,9 |
2,45 |
0,04 |
|
1992 |
114 |
181,4 |
50,4 |
21 |
3,77 |
0,1 |
|
1993 |
129,3 |
192,4 |
73,1 |
33 |
5,59 |
0,2 |
|
1994 |
132,8 |
190,9 |
87 |
38,6 |
5,89 |
0,55 |
|
1995 |
203,2 |
270,5 |
99,7 |
47 |
12,08 |
0,3 |
|
EU inflows |
EU outflows |
EU balance |
US+CNDinfl. |
US+CNDout. |
US+CNDbal. |
Jap inflows |
Jap outflows |
Jap balance |
|
|
1984-89 |
37702 |
62641 |
24939 |
48656 |
21511 |
-27145 |
81 |
20793 |
20712 |
|
1990 |
97387 |
132959 |
35572 |
55773 |
31900 |
-23873 |
1753 |
48024 |
46271 |
|
1991 |
77715 |
106842 |
29127 |
24760 |
39111 |
14351 |
1730 |
42619 |
40889 |
|
1992 |
79812 |
108716 |
28904 |
22097 |
42613 |
20516 |
3490 |
21916 |
18426 |
|
1993 |
74467 |
91488 |
17021 |
46125 |
74803 |
28678 |
234 |
15471 |
15237 |
|
1994 |
64017 |
101070 |
37053 |
55803 |
50421 |
-5382 |
908 |
18521 |
17613 |
|
1995 |
111920 |
132285 |
20365 |
71418 |
100291 |
28873 |
39 |
21286 |
21247 |
Source: our own compilations from Bailey, Parisotto and Renshaw, 1993, and UNCTAD, 1996
Acquisitions of foreign assets by US residents slowed sharply, and total net capital inflows of $43.1 thousand million were recorded in the first quarter of 1996. Apart from the USA, the LDCs - especially in East and South Asia and the Americas - became the major investment areas of the international order, while Europe as a whole loses (with shifts between Western and Eastern Europe still being likely). Thus, Eastern Europe could become again a contested zone of influence - in between the eastward expansion of west European, Asian and North American capital and a newly asserted Russian power projection. Graph 10.1 now shows the volume of center exports and imports and the balances for the different trade blocs in the world economy. It should be kept in mind, that Russia’s energy-export-driven positive current account balance still biases the picture for Eastern Europe.
Graph 10.1b: world trade between the major power blocs
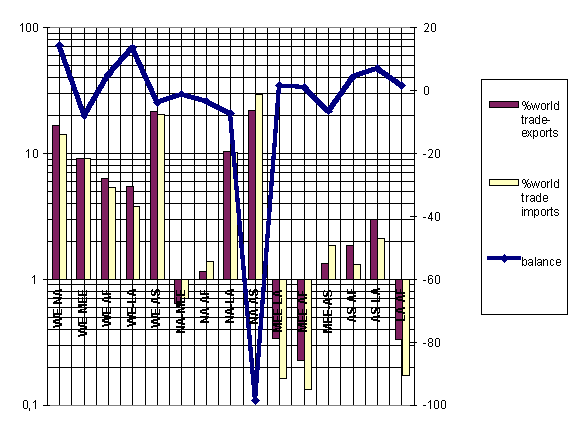
Legend: left hand, logarithmic scale: columns, percent of the regions exports (imports) to other world regions in % of total world exports (imports). Line (right hand scale) is the trade balance of the exporting/importing region. The WTO raw data were:
|
Region |
%world trade-exports |
%world trade imports |
balance |
|
WE-NA Western Europe-North America |
16,6752445 |
14,0239271 |
14,3 |
|
WE-MEE Western Europe-Eastern Europe and former USSR |
9,05815749 |
9,11507786 |
-8 |
|
WE-AF Western Europe-Africa |
6,27895008 |
5,31712875 |
5 |
|
WE-LA Western Europe-Latin America |
5,45548121 |
3,75047474 |
13,5 |
|
WE-AS Western Europe-Asia |
21,6160576 |
20,3190277 |
-4 |
|
NA-MEE North America-Eastern Europe+former USSR |
0,63818837 |
0,70262058 |
-1,2 |
|
NA-AF North America-Africa |
1,14256305 |
1,38625142 |
-3,5 |
|
NA-LA North America-Latin America |
10,2933608 |
10,2069882 |
-7,5 |
|
NA-AS North America-Asia |
21,7704581 |
29,4341056 |
-98,5 |
|
MEE-LA Eastern Europe-Latin America |
0,33968091 |
0,16141284 |
1,6 |
|
MEE-AF Eastern Europe- Africa |
0,22645394 |
0,13292822 |
0,8 |
|
MEE-AS Eastern Europe-Asia |
1,3381369 |
1,86099506 |
-6,6 |
|
AS-AF Asia-Africa |
1,85280494 |
1,31029244 |
4,2 |
|
AS-LA Asia-Latin America |
2,98507463 |
2,10786175 |
6,8 |
|
LA-AF Latin America-Africa |
0,32938755 |
0,17090771 |
1,4 |
WTO data, as quoted in Zeitpunkte, 1/1997: 12
Western Europe could be tempted, in order not to fall behind China, to overexploit Latin America and Africa, and to try to shift the present favorable East European and former Soviet balance in its favor, while North America’s negative balance with Asia is also an expression of the dramatic shifts in the production of multination US corporations.
Outward foreign direct investment stock of western European countries increased dramatically its share in West European gross domestic product, as one of the most visible signs of the process of globalization:
Graph 10.2a: the share of outward foreign direct investment stock in gross domestic product from 1980 - 1994 of major economic power groups in the world system
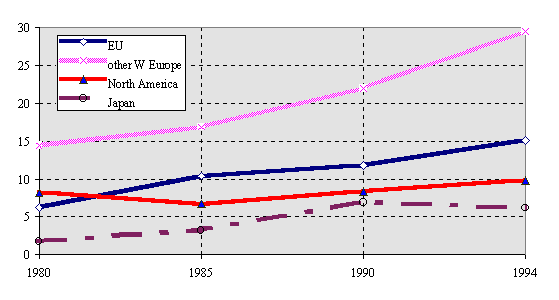
Legend: the share of outward foreign direct investment stock in gross domestic product from 1980 - 1994 of major economic power groups in the world system. Source: our own compilations from UNCTAD, 1996
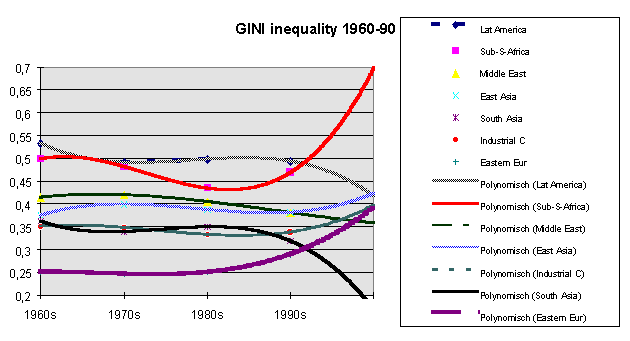
It is to be expected, that world capitalism is on its way towards an anti-egalitarian, and de-regulatory phase which will do away with many of the social advances that characterized the corporatist economic cycle of the post-World-War-II period. A recent analysis by Deininger and Squire compares the evolution of the GINI-coefficients of inequality in the different regions of the world from 1960 onwards and comes to the following results:
Graph 10.2b: inequality from 1960 onwards in the world system
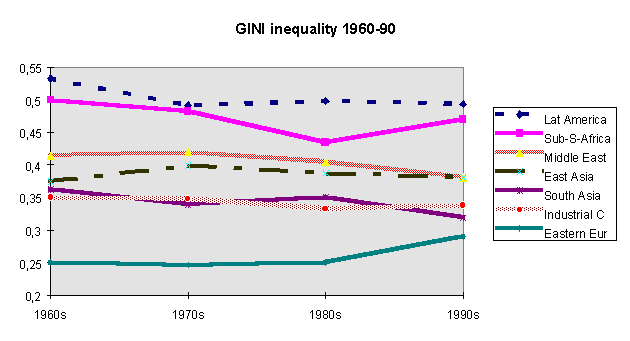
Legend: The Gini coefficient of income inequality in the different regions of the world system from 1960 onwards. The Gini coefficient ranges from 0 (maximum equality) to 1 (maximum inequality). Source: our own compilation from Deininger and Squire.
From these data it is also possible to arrive at the following projections of inequality until the year 2000. South Asia’s and Latin America’s inequality will decline, while in Sub-Saharan Africa, in the industrialized countries, and in Eastern Europe inequalities will increase considerably, and in the Middle East and North Africa there will be only a slight reduction of inequality rates:
Graph 10.2c: The future of world inequality
Legend: see above. Source: our own EXCEL projections from Deininger and Squire, 1997
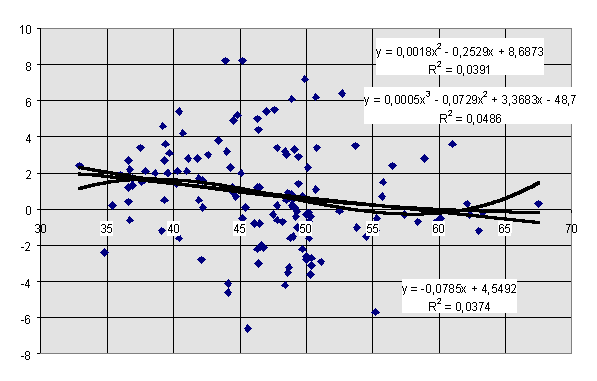
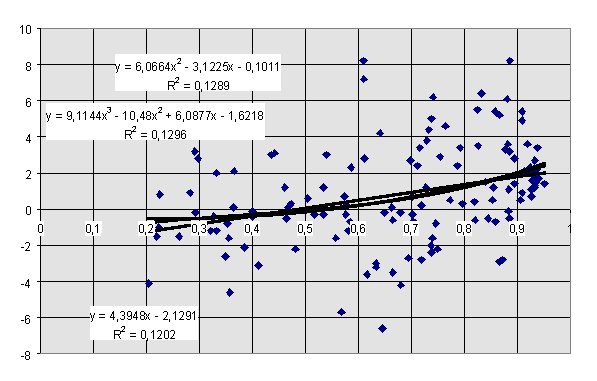
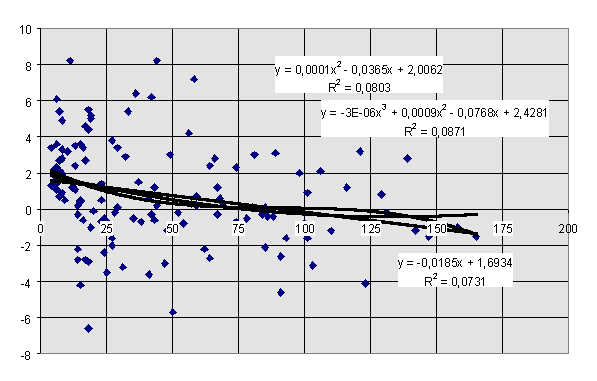
The growth of inequality in Eastern Europe, in Sub-Saharan Africa and in the industrial countries might herald the advent of a ‘Latin-American’-style capitalism of the 1960s and 1970s, that goes hand in hand with mass migration, the growth of transnational corporations penetration, short-term spurts of growth and long-term stagnation, and protected markets and economic distortions. The imperative of ‘balanced budgets’, ‘financial markets’ and ‘de-regulation’ might, in the end, undermine the very logic of economic growth that the anti-Keynesianism of the 1990s maintains to uphold. Comparative data for the 1980s and 1990s show, that inequality - as in the past - has no positive relationship to economic growth, and that, rather, the opposite is true. Because of the limitations of income inequality data, we test this important relationship also with other indicators of inequality:
Graph 10.3: inequality measures and economic growth
income inequality (x-axis) and economic growth (y-axis) in the world system
Human development index (x-axis) and economic growth (y-axis) in the world system
Infant mortality (x-axis) and economic growth (y-axis) in the world system
Human capital formation (mean years of schooling) (x-axis) and economic growth (y-axis) in the world system
Sources: income inequality data from UNDP, Moaddel and WDR Human Development Report, 1996; other variables: UNDP. All test series at least show that equality is not detrimental to economic growth on a global scale
Samir Amin and Giovanni Arrighi most vocally proclaim today the idea that there has never been any ‘catching up’ of the semi-peripheries and peripheries, and that there is a fairly constant real gap between the rich and the poor regions in the world system. Thus, the ‘Asian crises’ are not an accident, but part and parcel of the structure of the transnational system that tends to petrify the system of inequality.
Apart from that dire enough fact, matters are - Amin’s argument goes - made worse by adhering to neo-conservative strategies in precisely those countries that would need a new political project. Passive, selective migration increases, rather than decreases the wealth gap between rich and poor lands.
Such a socio-liberal interpretation of dependency theories also receives qualified support from a careful analysis of existing UNDP data about the determinants of absolute income growth from 1960 onwards. 58 nations experienced an absolute, not only relative, decline, of their real per capita incomes in the 1980s (Nohlen, 1991). While the monopoly position in the international system, as expressed by years of membership in the UN, together with the social security effort are a significant positive contribution to growth, human rights violations and population density rates are significantly blocking long-run economic growth. The second equation listed in Table 10.1 even more optimistically mentions social security expenditures, mean years of schooling and the Human Development Index as a precondition of absolute income growth. In between them, our predictor variables account for over 80% of the real, absolute income growth in the world system between 1960 and 1990. To avoid severe problems of collinearity, the Matthew’s effect was dropped from the equations, substituted by political and human rights or mean years of education and the Human Development Index.
Table 10.1b: the absolute real income increase from 1960 to 1990 in the world system
|
Violations of Political Rights |
Violation of Civil Rights |
Population Density^0,5 |
Terms of Trade |
MNC PEN73 |
Government Consumption |
|
|
growth in the |
-387,6044339 |
-335,5309726 |
-38,35553994 |
-159,3658871 |
-2,142065598 |
-38,08417293 |
|
sense of Arrighi’s and Amin’s theory |
147,1946027 |
756,8905041 |
14,7393743 |
773,404945 |
18,01237032 |
28,8547924 |
|
0,80679169 |
||||||
|
29,78709404 |
107 |
|||||
|
t-Test |
-2,633278848 |
-0,443301866 |
-2,602250215 |
-0,206057497 |
-0,118921916 |
-1,319856071 |
|
Trade Dependency |
social security effort |
UN membership years |
% Women in Parliament |
Women % Labor Force |
ethno-linguistic fractionalization |
|
3,383706329 |
353,0850466 |
14,16819598 |
58,90557906 |
-2,079932631 |
-8,378867087 |
|
16,17414266 |
42,82585478 |
6,800556167 |
44,53034007 |
1,379485421 |
14,31186935 |
|
0,209204679 |
8,244670153 |
2,083387833 |
1,322818981 |
-1,507759777 |
-0,585448825 |
|
public investment |
ln(MPR+1)(military personnel) |
Fertility Rate |
constant |
|
24,90210293 |
-166,5370259 |
137,2074945 |
3642,23847 |
|
7,916573906 |
280,3858807 |
209,1100071 |
2191,222144 |
|
3,145565649 |
-0,593956534 |
0,656149825 |
Legend: as in all EXCEL 5.0 outprints in this work, first row: unstandardized regression coefficients, second row: standard errors, last row: t-Test. The values immediately below the standard errors are R^2 (third row, left side entry), F, and degrees of freedom (fourth row).
Alternatively, one might also express:
|
MNCP85 |
Govexpenditures |
Trade Dependency |
social security |
UN-member years |
Women in Parliament |
Women % LF |
mean y ears of schooling |
HDI |
ln(MPR+1) |
Fertility Rate |
Constant |
|
|
absolute |
-0,1024 |
-313,04 |
1145,54 |
304,721 |
14,0635 |
-33,038 |
-15,546 |
336,965 |
28,15 |
-25,605 |
-6,937 |
-907,19 |
|
growth |
195,851 |
697,948 |
1775,06 |
146,832 |
17,3298 |
27,872 |
15,0547 |
43,5687 |
5,40439 |
15,8157 |
12,008 |
1882,33 |
|
0,80028 |
||||||||||||
|
40,4342 |
111 |
|||||||||||
|
t-Test |
-0,0005 |
-0,4485 |
0,64535 |
2,07531 |
0,81152 |
-1,1853 |
-1,0326 |
7,73411 |
5,20873 |
-1,6189 |
-0,5777 |
Legend: As in all EXCEL 5.0 outprints in this work, first row: unstandardized regression coefficients, second row: standard errors, last row: t-Test. The values immediately below the standard errors are R^2 (third row, left side entry), F, and degrees of freedom (fourth row). Absolute real income increase is understood to be the difference between PPP $ income in 1990 to PPP $ income in 1960
Since for Arrighi and Amin the international hierarchy is an international hierarchy of wealth, the relative distances of poor to rich countries is of enormous relevance at a given time-point in the international system. The real purchasing power income of the richest country in 1960 and 1990, the United States, is put at 100 in each case; relative mobility is defined as the difference between the position in 1990 (USA PPP $ income = 100) from the position in 1960 (USA PPP $ income = 100). The socio-liberal variables: mean years of schooling, the already existing position in the international power networks (years of UN membership) and the Human Development Index enhance international mobility, while MNC penetration and a costly social security system work against international mobility:
Table 10.2: mobility in the international system
|
MNCP85 |
Govex |
Trade Dep |
social sec |
UN-membery |
Women Parl |
Women %LF |
mean years schooing |
HDI |
ln(MPR+1) |
Fertility Rate |
Constant |
|
|
international mobility |
-1,9435 |
3,40219 |
1,91357 |
-1,3193 |
0,16456 |
-0,1978 |
-0,103 |
1,19691 |
0,11091 |
-0,0914 |
-0,0754 |
6,86977 |
|
0,8866 |
3,15955 |
8,03555 |
0,66469 |
0,07845 |
0,12617 |
0,06815 |
0,19723 |
0,02447 |
0,0716 |
0,05436 |
8,52114 |
|
|
0,57749 |
||||||||||||
|
13,7925 |
111 |
|||||||||||
|
t-Test |
-2,1921 |
1,0768 |
0,23814 |
-1,9848 |
2,09762 |
-1,5679 |
-1,5109 |
6,06857 |
4,53334 |
-1,2767 |
-1,3862 |
Legend: as in all EXCEL 5.0 outprints in this work, first row: unstandardized regression coefficients, second row: standard errors, last row: t-Test. The values immediately below the standard errors are R^2 (third row, left side entry), F, and degrees of freedom (fourth row). Relative mobility is defined as the difference between the position in 1990 (USA PPP $ income = 100) from the position in 1960 (USA PPP $ income = 100)
The international system in the 1990s is characterized, as Arrighi correctly remarks, by two tendencies
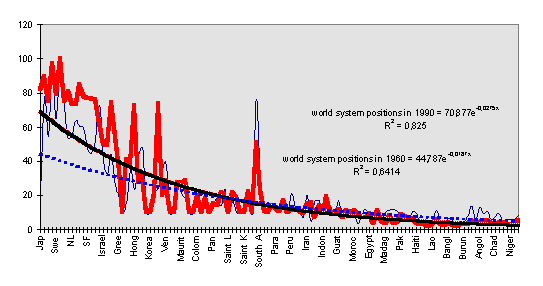
For Arrighi, the GNP per capita at current exchange rates is the best available measurement of the goods and services that the residents of different countries command on the world markets (Arrighi et al., 1996a). Personally, I have no doubt about Arrighi’s results, based on such a methodology, although the implementation of his research program into empirical tests, based on polynomial regressions, might be surprising to some observers. The international system is characterized by the stability of distribution between peripheries, semi-peripheries and centers: that is Arrighi’s main research result. To control Arrighi’s results, we use a slightly different methodology. For us, the international hierarchy of the 123 countries of the world with fairly complete UNDP data about the social and economic system (listed in descending order of their UNDP Human Development Index) is also a stable hierarchy of real purchasing power parity rates (PPP $) in relation to the USA, the country with the highest PPP $ value in both 1960 and 1990 (USA = 100). The exponential regression lines for 1960 and 1990 show, that the ‘band spread’ of international distribution has widened, and that a considerable number of states even experienced a relative downward-mobility, while less than half of the states in the world system experienced an upward mobility, as evidenced by the two exponential trend lines and their cutting point:
Graph 10.4: aspects of international income distribution, 1960-1990
Legend: real income per capita in purchasing power parity rates and constant US $, 1960 (left hand scale) and 1990 (right hand scale), ranging from the highly developed nations to the poorest countries. Put in simple terms: there is a trend, that the poorest countries lose in relative terms.
At closer inspection, the trend lines in the above graph show the following characteristics and moved in the following direction:
Legend: see above.
Some observers might contend, that an exponential trend line and not a polynomial regression best reflects the underlying values. To satisfy such arguments, we include here the following results:
Legend: see above. The difference between the two Graphs above is the mathematical formulation of the trend lines. The relative polarization effect appears clearly visible in both formulations (polynomial expression versus exponential trend line).
Alternatively, Arrighi’s own peculiar methodology can also be applied:
Graph 10.5: Arrighi’s hypothesis of the constancy of international inequality
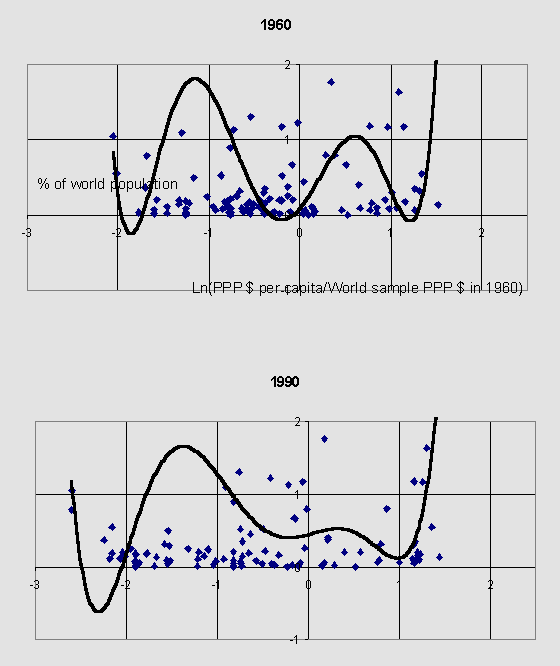
Legend: Giovanni Arrighi developed the following method to measure world development polarization: on the x-axis you have the logarithm of the per capita income for each country of the world, divided by the world per capita income of the respective period; on the y-axis you have the share, that each country of the world system has in total world population. Our own calculations from UNDP, HDR, current issues.
Legend: results according to our methodology as compared to the results, based on Arrighi’s method, based on the following regression analysis:
(10.1) % of world population = a0 + b1 * (ln (GNP per cap/World GNP per capita)) +-b2 * (...)^2 +- b3 * (...)^3 ....
We used here, like Arrighi (1996a), a polynomial regression of the 6th degree (Arrighi, 1996a; pages 11 and Figure 7
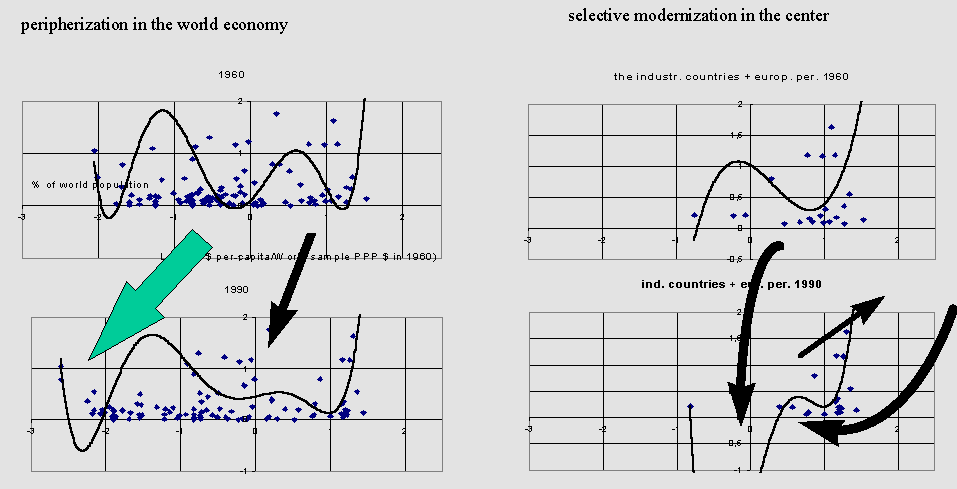
Whatever methodological preference we have, our analysis confirms the shape of distribution, expected for the dependency model of global polarization, and certainly not the modernization hypothesis, which clearly would expect a closing of the gaps. Our results also show, that the W-shaped distribution with strong semi-peripheries, expected by the world system approach (Arrighi, 1996a), has become weaker over time, resembling more and more the distribution, expected by classic dependency theory.
Thus, international mobility in the age of globalization is a myth. Asian or Mexican crashes (who knows: Polish, Italian, or Russian crashes in the future) are not accidents, but part and parcel of the very structure of the system, that crushes in periodical regularity the material progress of working generations in the semi-periphery countries and wipes out their dreams of catching-up one day with the center.
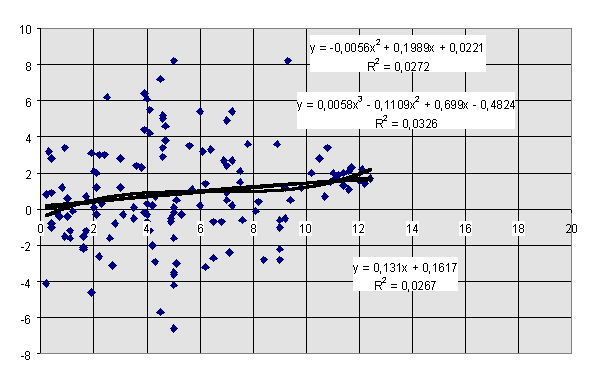
Our analysis also shows the effects, that transnational migration has on the sending and on the receiving countries in the context of overall dependency mechanisms across long cycles. The hope of many semi-periphery and periphery nations to change their weak position in the world-wide structure of the division of labor by mass migration to the developed countries is also not realistic. These findings could have an implication not only for the social scientific, but also for the political debate in Europe. At present, ‘green’, ‘alternative’ and socialist-left-wing groups claim that Western Europe should allow more immigration from the South and the East. But migration greatly increases inequality in the migration recipient countries, without really solving the long-run weak position of the sending countries in the international economy. If the ‘migration industry’ were right, then Jordan, Mexico, Jamaica, ex-Yugoslavia, Greece, Portugal and other highly migration-dependent countries would be ‘economic miracles’. In the migration recipient countries, environmental decay, as measured by the UNDP greenhouse index, increases as one of the main consequences of the process of international migration, due to mass traffic and the consumption model that mass migration induces. For us, migration is - above all - an expression of a peripheral position in the world economy. At first sight, migration has practically no positive or negative effect on economic growth, as is to be shown in the following graph:
Graph 10.6: migration, economic growth, inequality, the greenhouse-index and human development
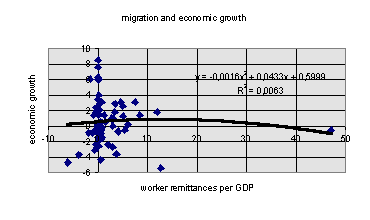
Legend: balance of worker remittances per GDP (x-axis) and economic growth (y-axis)
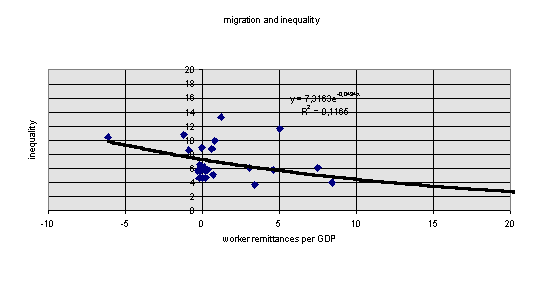
Legend: balance of worker remittances per GDP (x-axis) and economic inequality (ratio of the income of the top 20% to the income of the bottom 20%)(y-axis)
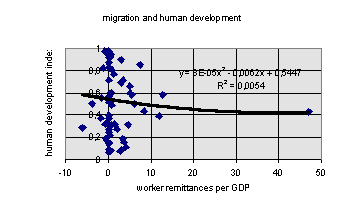
Legend: balance of worker remittances per GDP (x-axis) and the human development index (y-axis). Sources: our own compilations from UNDP data
The dominant countries, like Japan or the United States, send their managers abroad, but never their workforce. It is a sign of world economic weakness to be a net exporter of labor force. Poor and peripheral countries, like Jordan, Pakistan, Ireland, Portugal, or nowadays Poland, send their workers abroad, and import their managers, and never the other way around. In the old colonial days, priests and soldiers were imported, timber, ivory, copper, slaves and bananas were exported. Still, the structure exists, but at a much higher level, with a lot of ‘soft body’ components as well. Interestingly enough, the effect of government size on growth becomes significantly and highly negative, once we consider the effect of migration on development. Introducing the variable: ‘worker remittances per total GNP’ into the above equations, we achieve for the countries with complete data on worker remittances the following results:
Table 10.3: The Pearson-Bravais-correlations of worker remittances per GDP with variables of economic growth
|
correlation with migration remittances |
|||
|
violation of political Rights |
0,135764074 |
||
|
violation of civil rights |
0,089359055 |
||
|
MPR (military personnel ratio) |
0,14053404 |
||
|
LEX 1990 (life expectancy) |
-0,027057736 |
||
|
years of female voting |
-0,169573413 |
||
|
government consumption |
0,192887408 |
||
|
social security expenditures |
-0,140420033 |
||
|
SIPE-Index (Social Insurance Programme Experience Index) |
-0,067276705 |
||
|
HDI (Human Development Index) |
-0,067212107 |
||
|
mean years of schooling |
-0,092704666 |
||
|
public investment |
0,167445822 |
||
|
deforestation |
0,046779686 |
||
|
war/internal war |
0,2430858 |
||
|
refugees per population |
0,154695136 |
||
|
genderpower |
-0,105728655 |
||
|
reserves per GDP |
-0,128414748 |
||
|
aid per capita |
0,175715292 |
||
|
Govex (government expenditures) |
0,256919337 |
||
|
GNP growth 80-92 |
-0,067212107 |
||
Table 10.4: International dependency and its effects on growth and adjustment, allowing for the influence of the migration process
|
MNC PEN73 |
Govex |
Trade Dep |
social sec |
UN-membery |
Women Parl |
Women %LF |
ln PCI |
ln PCI^2 |
ln(MPR+1) |
Fertility Rate |
migration |
constant |
|
|
Adjustment |
-0,143 |
-1,13 |
0,525 |
0,589 |
-11,5 |
-0,018 |
-0,033 |
-0,05 |
0,115 |
-0,02 |
-0,02 |
-0,004 |
60,89 |
|
0,049 |
0,207 |
1,195 |
0,404 |
6,05 |
0,026 |
0,05 |
0,027 |
0,081 |
0,017 |
0,036 |
0,003 |
22,69 |
|
|
0,56 |
2,072 |
||||||||||||
|
5,402 |
51 |
||||||||||||
|
278,4 |
219 |
||||||||||||
|
t-Test |
-2,897 |
-5,452 |
0,439 |
1,456 |
-1,901 |
-0,671 |
-0,667 |
-1,852 |
1,426 |
-1,191 |
-0,552 |
-1,278 |
|
|
MNC PEN73 |
Govex |
Trade Dep |
social sec |
UN-membery |
Women Parl |
Women %LF |
ln PCI |
ln PCI^2 |
ln(MPR+1) |
Fertility Rate |
migration |
constant |
|
|
growth |
-0,119 |
-1,42 |
1,832 |
0,42 |
-9,152 |
-0,01 |
-0,008 |
-0,041 |
0,063 |
-0,019 |
-0,017 |
-3E-04 |
53,4 |
|
0,046 |
0,194 |
1,12 |
0,379 |
5,671 |
0,025 |
0,047 |
0,025 |
0,076 |
0,016 |
0,034 |
0,003 |
21,27 |
|
|
0,614 |
1,943 |
||||||||||||
|
6,767 |
51 |
||||||||||||
|
306,4 |
192,5 |
||||||||||||
|
t-Test |
-2,569 |
-7,307 |
1,636 |
1,108 |
-1,614 |
-0,407 |
-0,179 |
-1,637 |
0,827 |
-1,166 |
-0,51 |
-0,113 |
Legend: As in all EXCEL 5.0 outprints in this work, first row: unstandardized regression coefficients, second row: standard errors, last row: t-Test. The values immediately below the standard errors are R^2 (third row, left side entry), F, and degrees of freedom (fourth row). The above results were achieved by inserting international migration remittances data (remittances per GDP) into our cross-national growth and development equations. Only countries with complete data were used.
Migration conserves economic structures that inhibit world economic adjustment. The greatest proponents of mass migration from the semi-periphery and periphery are in reality those very social strata, that represent the powerful urban power monopolies at home: instead of bringing their monopolies under the discipline of the market and allowing their agricultural regions to prosper under a system of export-led growth and mass-demand at home, they are inclined to send a considerable part of their talented work-force abroad so that it does not constitute any threat to the elites’ privileged social position at home. State sector expenditures and a reliance on foreign aid will be part and parcel of a such a migration-driven development model. The state sector effect described above is significant at the 12.5% level and narrowly misses the 10% mark. 61.4% of economic growth are explained by our migration-centered equation. Although small and open economies - especially in Europe (like Austria) - tend towards higher economic growth rates and a less painful structural adjustment towards the realities of the evolving post-1982/89 world economic and social order, it stands out very clearly, that under due consideration for the effects of migration on growth, the critique of the state sector and excessive social security burdens becomes all the more relevant.
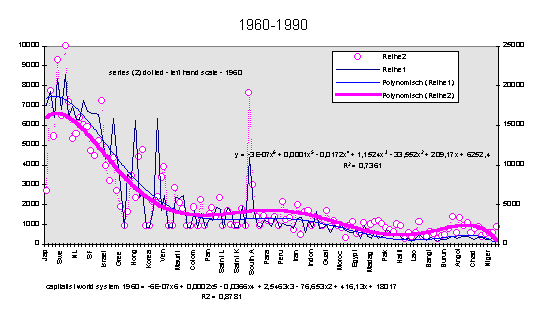
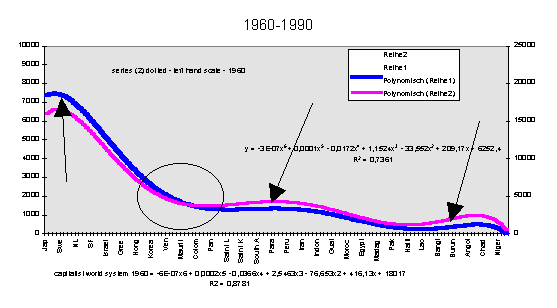
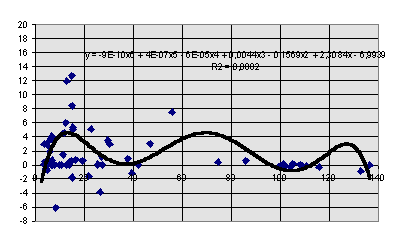
As already predicted by Rostow and others, migration is closely connected to the tendencies of the Kondratieff cycle, as is to be seen from the following Graph:
Graph 10.7: migration balances and the Kondratieff cycle
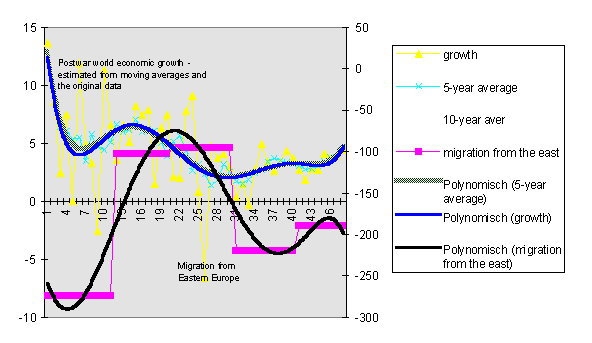
Legend: economic growth (left hand scale) and migration balances from Eastern Europe (right hand scale) during the Kondratieff cycle from 1950 onwards. Slowly, Eastern Europe’s outward migration potential recedes, as the countries will become immigration regions themselves, like Southern Europe before
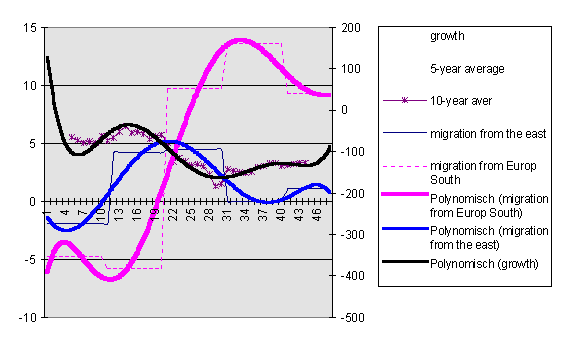
Legend: This graph compares the results from the above graph (economic growth, left-hand scale) with the migration balances in Eastern and Southern Europe (right hand scale). Southern Europe became an immigration region long ago, and tightened its borders, as East Central Europe will most probably tighten its own borders.
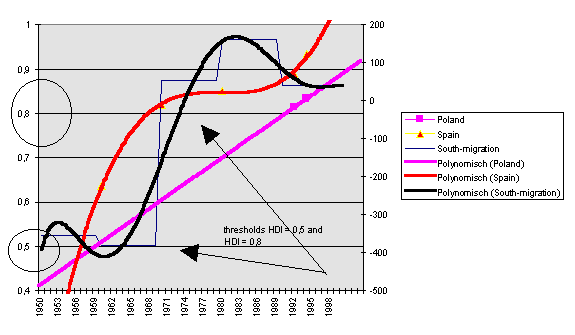
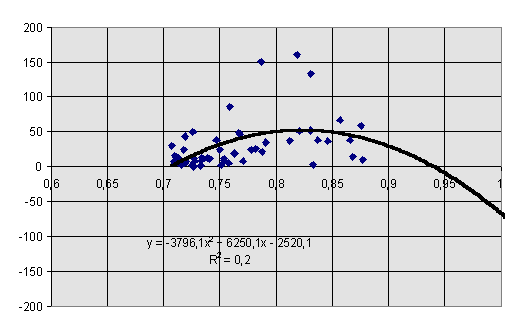
Legend: human development index (left hand scale) and outward migration balance (right hand scale). The darker non-linear trend line (‘polynomial, south-migration’) indicates migration balances for Europe’s South, while lighter trend line (‘polynomial, Spain) indicates the human development experience of Spain since 1960 (left-hand scale). The straight trend line is the probable course of Polish human development. It reaches the 0.900-human-development-threshold for migration certainly by the end of the century (last UNDP published measurement 0.834; the European South became a net importer of labor after reaching these human development levels. The graph, as before, combines data from Chapter 3 of this study and data about the globalization of migration from IFRI (1998). The economic cycle in Eastern Europe is time-lagged in comparison to the world economic cycle. Southern Europe becomes a major immigration region; whose importance grows with the downswing of the world economic cycle. During an upswing, immigration to Europe’s South will decline. The data series again starts with 1950. The last graph compares the migration balance in the European South with the evolution of Spain’s UNDP Human Development Index since 1960. The graph shows the two migration policy thresholds of HDI = 0.500 and HDI = 0.800 and compares the Spanish HDI performance over time with the UNDP figures for Poland. Not before long, Poland will become - according to this reasoning - a net immigration country, reaching a human development index of 0.900.
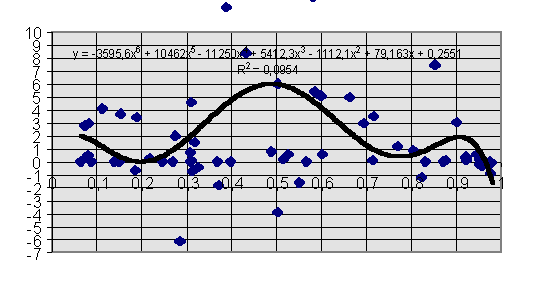
It can also be shown, that the propensity to migrate is a function of the Human Development Index of a society, and that migration is connected to the redistribution struggles in world society, described in this Chapter (equation 10.1). Two data series are used here to test this hypothesis. In Graph 10.8 we show the trade-off between the Human Development Index and migration propensity in 49 Polish voivodships (provinces):
Graph 10.8: the trade-off between migration and human development in 49 Polish voivodships
Legend: Polish voivodship migration propensity (y-axis) is being explained by the human development index of a voivodship (x-axis). Migration propensity of a province is measured by the migration balance of a province * 100 divided by the number of inhabitants of the province (thousands). Migration balance data: Polish Central Statistical Office; Human Development Index: UNDP Poland (1996).
With the rise of the Polish Human Development Index, migration propensity will decrease, and the country will become a net importer of labor.
Our following analysis now shows the relationship between the three-layer-structure of the world system in the sense of Arrighi’s theory and the structure of transnational migration. Far from being a strategy of world economic ascent, mass migration is a phenomenon at the periphery, and the poorer and richer semi-periphery level. Graph 10.9 shows the trade off between migration dependence of a society (as measured by the balance of worker remittances per GDP) and the development level (PPP GDP per capita in % of the European Union average) (a) and the Human Development Index (b), again supporting our above hypotheses:
Graph 10.9: migration propensity and development on a world scale:
a) PPP GDP per capita in % of the European Union average (x-axis) and balance of worker remittances (y-axis)
Legend: real purchasing power of a country in percent of the European Union average real purchasing power (each measured in PPP $) (x-axis) and the balance of worker remittances per GDP in % (y-axis). Source: our own compilations and calculations from UNDP Human Development Report. Note the three-layer structure that is similar to Graph 10.4 and 10.5 with three summits.
Legend: x-axis: the Human Development Index of a country of the world system. Else: see above. Note again the three-layer structure that is similar to Graph 10.4 and 10.5 with three summits.
The application of GDP or GDP PPP data alone could be very misleading in determining ‘migration policy thresholds’, viz. the negotiations between the (East) Central European accession countries and the European Union. The Human Development Index by far better reflects the overall social situation of a country than the mere application of real purchasing power parity rate GDP data. We look therefore at the historic trajectory of human development in the world’s main sending countries. Poland seems to be well beyond the 0.800 human development threshold, and in future will become a migration target country:
Graph 10.10: human development in migration societies
Legend: data analysis and projections about the human development trajectory of migration societies in the world system since 1990. Y-axis: the Human Development Index. Source: our own compilations from UNDP HDR, 1997 and IFRI, 1998. The number of people who emigrated from these countries were (millions of people)
|
Mexico |
7.1 |
|
Bangladesh |
5.0 |
|
Philippines |
4.5 |
|
Afghanistan |
4.2 |
|
Pakistan |
2.9 |
|
Vietnam |
2.2 |
|
Algeria |
1.8 |
|
Egypt |
1.5 |
|
Poland |
1.4 |
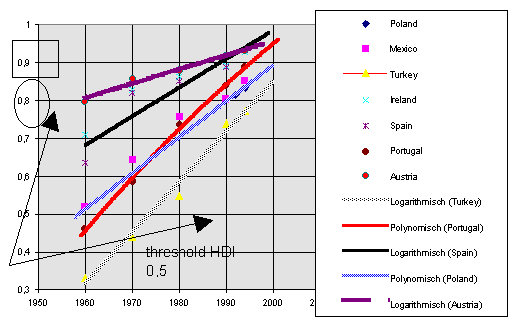
Poland already achieved a development level (measured by the human development index) that corresponds to the levels of Austria in the late 1960s, Spain in the mid 1970s, and Portugal in the late 1980s. Seen in such a way, there is reason to believe that the tide of migration from Poland already reached its climax in the 1980s, and that from now on, Poland will slowly become a net-immigration country.
Without doubt, migration propensity is highest at a human development level that corresponds to the value 0.6 to 0.5 of the HDI (Human Development Index); i.e. countries like the Ukraine, the Philippines, Indonesia, Mongolia, Albania, Armenia, China, Egypt, El Salvador, Morocco, Vietnam. This hypothesis would also correspond to the every-day experience of any migration official around the world. Countries in the vicinity of HDI = 0.89 or more, like Portugal, Chile, Singapore, Italy, or Greece, cease to be the source of mass migration. The three-layer structure corresponds also to careful interpretation of different migration ‘waves’: the migration of rural laborers, the migration of industrial workers, the migration of service-personnel, and the migration of intellectuals at all three phases. Instead of leveling-off international hierarchies, migration is indeed, as Samir Amin foresees it, one of the 5 pillars of international inequality, cementing the unequal positions in the world system instead of leveling them off. Map 10.1 summarizes the tendencies of human development on a European scale. We selected here the following method in order to show the potentials and risks of the accession process. Western Europe’s human development is measured in Map 10.1a) by the year 1980, before the EU last wave of expansion, while the candidate countries’ human development is measured by the year 1994, the last year with available data. It is to be shown, that a large number of today’s accession candidates already fulfill the conditions of the West European countries by 1980, while today’s Croatia, Latvia, Lithuania, Moldova, Romania and Ukraine are at the level of Portugal 1980, Bulgaria, Poland, and Turkey reach the level of Greek and Spanish human development in 1980, while Hungary and Slovakia are already at the level of Austria, Belgium, Finland, Ireland and Italy in 1980. Slovenia and the Czech Republic reach already a level of human development that is equal to that of Denmark, Germany, and the Netherlands in 1980. Map 10.1b) shows the human development gaps of today on an actual scale. Without EU enlargement, these pan-European differences would have been much greater:
Map 10.1: human development in Europe before EU accession processes
a) comparison: Western Europe (1980), accession countries (1994)
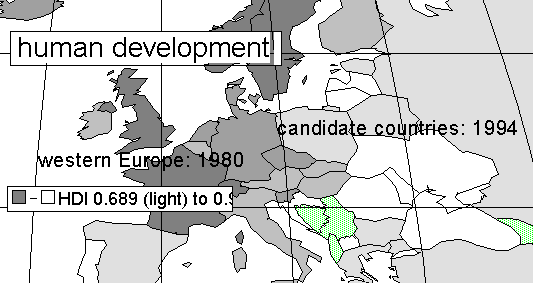
Legend: human development indices in Western Europe (1980) compared to those of the accession countries, 1994. Our own compilations from UNDP Human Development Report, 1997, and the EXCEL map system.
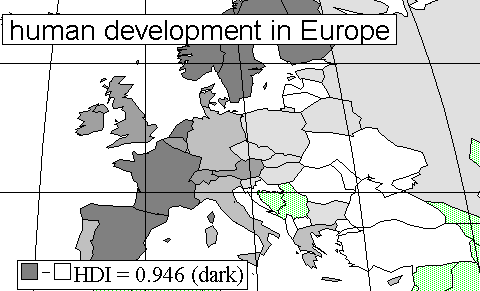
Legend: the contemporary human development differences in Europe range from France = 0.946 to Albania = 0.655. Thus, they are as large as those between, say, USA (0.942) and Peru (0.717). Sources: see above
At any rate, it would be naive to assume that aid can be a substitute for structural policy to overcome the migration propensity of a society, which, in the end, is nothing but the reaction of a semi-periphery or a periphery to the ups and downs of three-layer structure of the international system in the Arrighian sense. In fact, aid recipients tend to be migratory labor exporters; and aid seems to be unable to reduce long-term migration propensity; on the contrary. The weak trade-off (R^2 = only 4.4%) between aid and migration propensity is the following:
Graph 10.11: aid per capita received and migration propensity
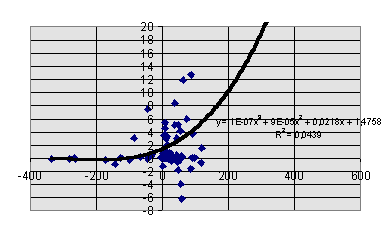
Legend: aid per capita (x-axis) and balance of worker remittances per GDP (y-axis) in the countries of the world system. A negative figure for aid per capita means, that a country is a net donor country. Source: our own compilations from UNDP HDR, various years. The graphical presentation excludes the out-layer Lesotho. Aid does not prevent migration.
Both in demographic as well as in sociological terms, much of West European fears about East European migration at least conceal the real issues of the future migration processes. An analysis of world population growth trends shows that Africa, West Asia and Southeast-Asia become the real future sending countries, while the demographic structure of East Central Europe more and more resembles the countries of Western Europe. We try to test this hypothesis in the following map:
Map 10.2: demographic pressure and future migration trends in the 21st Century
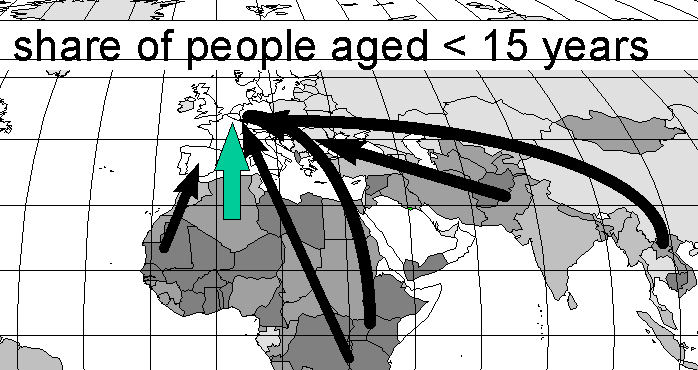
Legend: the share of people aged 0-15 years per total population. The darker, the higher is the share of the young population per total population. Source: EXCEL map system.
Schengen, in a way, is likely to control these migration flows for some years. But after? It is entirely possible, that outward migration pressure from Sub-Saharan Africa and West, Central and Southeast Asia in turn will have long-lasting effects on the countries of Eastern Europe, Turkey, and the Arab countries. To the degree, that Western Europe effectively seals its borders via the Schengen system, and Eastern Europe develops, migration pressures will be re-directed in the following way:
Map 10.3: migration pressure and the Schengen accords
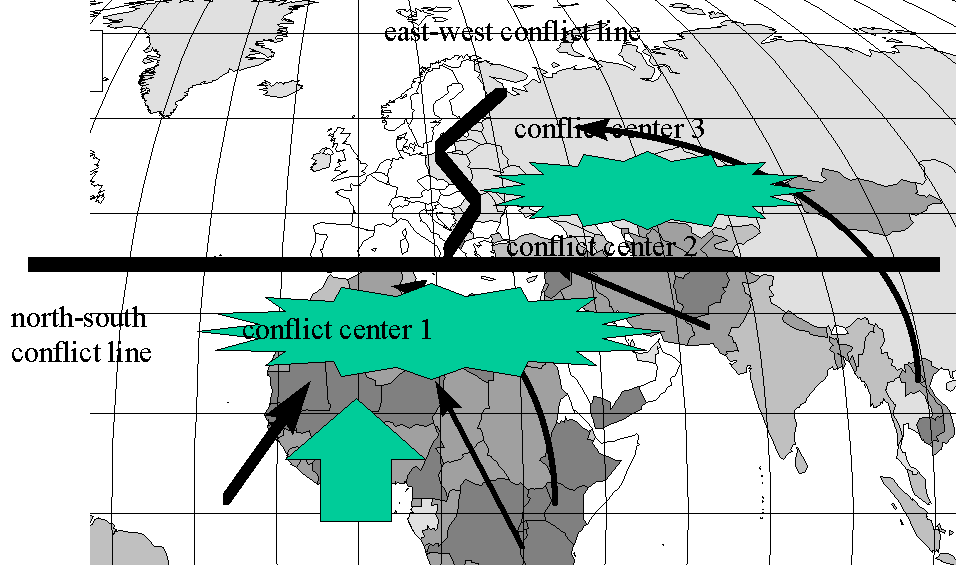
Legend: the darker, the greater the age-structure-determined migration potential
For that reason, East Central Europe already by now should be integrated in a pan-European system of migration reception from third countries, that could be modeled around the present-day Canadian immigration system (candidates with skills, which are still scarce on a more flexible European labor market, receive the permission to stay and to look officially for work for a given time period; if the candidate successfully can settle; asylum strictly limited to circumstances of severe human rights violations; one centralized European asylum application process; redistribution of asylum seekers around the entire European Union to avoid the overburdening of up to now soft, popular countries or countries, neighboring conflict centers). To close the borders completely, that is to say, to practice Schengen alone without any positive attempts at ‘Canadization’ of the immigration process, will lead to more and more conflicts and even bloodshed. The East Central European accession countries must be early on brought into this system of selective immigration and border management, because else the end-result could be the following process:
Map 10.4: the breakdown of the Schengen system, 2010?
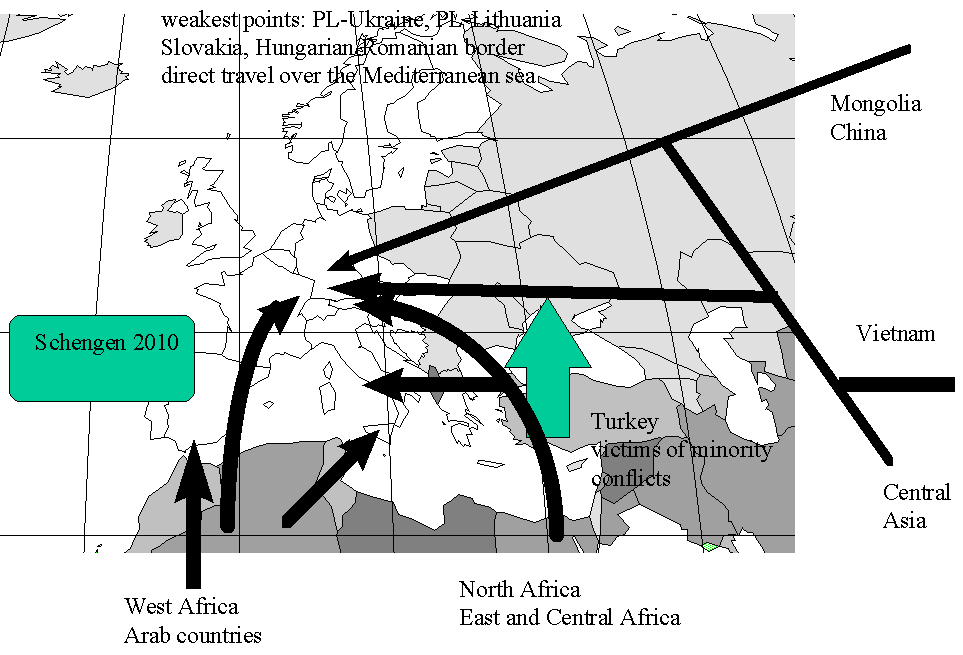
Legend: this scenario would assume, that Western Europe makes no or no decisive efforts to integrate the accession countries into the European Union early on, and does not decisively contribute to a pan-European system of migration management.
Finally, we think that mass migration, especially illegal migration, is closely inter-linked with the changing structure of the elites in the capitalist world system away from ‘legal’ to ‘semi-legal’ and ‘illegal’ business undertakings. Extraction and protection money, forced prostitution, all belong nowadays to a structure, which will increasingly affect the reform countries of East and Central Europe, when they themselves will become targets of mass migration. Just take this article from the ‘Washington Post’ as an example of the evolving structures:
Organized Crime Goes Global While the U. S. Stays Home
The Washington Post
May 11, 1997
Edition: FINAL
By: John F. Kerry
Most Americans still refuse to believe just how well-organized global crime has become. Such groups as the Russian mafia and the Chinese triads exist only in the slick fantasy world of television, movies and thriller novels.
Like the dark and powerful men of the "Godfather" trilogy, they may thrill us or chill us, but we don't recognize them as a serious, unprecedented threat. But a new criminal order is being born, more interconnected, violent and powerful than the world has ever seen. To fight it, we have to make fundamental changes in our legal and law enforcement structure, and encourage other nations to do the same.
In strategy, sophistication and reach, the criminal organizations of the late 20th century function like transnational corporations and make the gangs of the past look like mom-and-pop operations. Today's criminal cartels use high-speed modems and encrypted faxes; they buy jet airplanes three or four at a time and even have stealth-like submersibles in their armadas. They hire the finest minds to provide the kind of complex accounting procedures any multi-billion-dollar empire requires.
In one sense, this phenomenon can best be understood as part of the same great process of change that is transforming nearly all aspects of modern life. As Harvard's Rosabeth Moss Kanter has said, "The world century is beginning. " And, I would add, the century of world crime. Crime has been globalized along with everything else -- except our response to it.
America is the great prize for criminals, the prime market for imported narcotics, weapons and vice. For that, Americans are, in part, responsible: We create the demand for these products. Individuals must be held accountable when they buy cocaine, guns and the services of prostitutes.
But we must also recognize that the temptation to purchase is now enhanced by sophisticated organizations totally focused on the global marketing of vicious products and violent services, and capable of the wholesale corruption of governments and societies to protect these enterprises.
As the former director of the CIA, James Woolsey, testified before my committee: "When international organized crime can threaten the stability of regions and the very viability of nations, the issues are far from being exclusively in the realm of law enforcement; they also become a matter of national security." A decade ago, my committee investigators and I began to uncover portions of a common international infrastructure for crime. We interviewed criminals inside various U. S. prisons and found that they had remarkable access to political figures in countries all over the world. This work led me to the drug network of Manuel Noriega and eventually to the place he laundered his money, the Bank of Credit and Commerce International (BCCI). During the dozens of hearings I held, I was able to expose a lot about this hidden world. But I felt that in the day-to-day headlines, some of the scope of what I was seeing had yet to be adequately described.
The new global criminal axis is composed of five principal powers in league with a host of lesser ones. The Big Five are the Italian Mafia, the Russian mobs, the Japanese yakuza, the Chinese triads and the Colombian cartels.
They coordinate with smaller but highly organized gangs with distinct specialties in such countries as Nigeria, Poland, Jamaica and Panama, which remains a significant transshipment and money-laundering point even after the arrest of General Noriega. Various alliances among these groups are still in the formative stage, but all indications are that those relations are rapidly becoming more complex and coordinated.
For instance, in the summer of 1992 the leaders of the Russian and Italian mobs held a series of secret summits in Prague, Warsaw and Zurich. Our intelligence on these kinds of gatherings is woefully inadequate, but we can tell much from the results. They decided that rather than compete in the drug trade, they would form a strategic alliance: The Sicilians now provide the know-how to acquire and market the drugs, and the Russians provide security for transit routes and distribution networks throughout the former Soviet empire.
To see where these interconnections can lead, consider such cases as the contract hit man who flew in from Moscow to kill an uncooperative store owner in New York, on behalf of the Organizatsiya. He got his fake papers by supplying the Sicilian Mafia with Soviet Army surplus ground-to-air missiles to smuggle into the Balkans to supply the Bosnian Serbs with the firepower to take on U. N. security forces.
As French journalist Roger Faligot documented in his recent book on Chinese crime, "The Invisible Empire," Chinese, Japanese and Colombian criminals are working together in the drug trade: "The Colombian cartels produce the cocaine, the Chinese take it in exchange for heroin that can then be smuggled into the U. S. The triads bring cocaine to Japan and distribute it with the help of the yakuzas. Then the Asian mafiosi launder their drug money in Europe. " The triads also have spun out extortion and loan-sharking operations to major British cities such as London, Manchester and Glasgow; heroin trafficking to Rotterdam; prostitution, gambling, robbery and contract murder to Germany; money laundering to Prague; weapons trafficking to Romania, and alien smuggling to Moscow.
In 1995, Italian officials uncovered a sophisticated joint venture between the Camorra crime group and the Russian mafia. The Russians received counterfeit $100 bills in exchange for giving the Italians property, possibly including a large bank, and significant arms shipments. The Italians also buy large quantities of the synthetic narcotics that are becoming a major industry in Russia.
There is evidence that the American mafia, perhaps in an effort to modernize and rejuvenate, is striking similar alliances. Anthony "Gaspipe" Casso, the former acting boss of the Lucchese crime family in New York, has told investigators about New York mobsters taking part in scams developed by the Russians, especially gasoline tax frauds and gasoline bootlegging.
"The Russians supplied the brains and the Mafia supplied the hit men," one investigator said.
America must lead the world in the fight against these private criminal enterprises just as we led the world in the fight against public criminal governments. But we cannot fight alone; we need to create a new international alliance to meet the threats, like the alliances that defeated fascism, communism and Saddam Hussein. We need a revolution in the way we conceive of every aspect of the law, from jurisdiction to punishment. We need to move beyond traditional notions of national sovereignty when those notions benefit only the bad guys.
When a Dominican hit man comes to the United States and engages in a contract killing that winds up also taking the lives of innocent bystanders, he knows he's scot-free if he can reach Dominican soil before the United States grabs him. The same is true if he is Panamanian, Costa Rican, Russian or, for all practical purposes, French. When a Colombian drug trafficker in a Honduran-flagged boat enters French or Dutch waters off the Caribbean island of St. Martin, he knows the pursuing U. S. Coast Guard vessel will have to stop at the three-mile limit.
We have to recognize that the world's patchwork quilt of legal systems is as much an anachronism as carbon paper. A working system of laws to combat transnational crime must be hammered out among nations of good will. These would include:
* Minimum standards of international law. Nations must agree both on a consistent system of laws and a consistent system of punishment. As matters now stand, money laundering is not a crime in Turkey or Russia; extradition is constitutionally banned in Colombia; and illicit financial dealings still account for too much of the business of banking systems in countries like Switzerland and Austria.
* Crackdown on money laundering. The dozen or so countries, such as the Cayman Islands, Cyprus and Vanuatu, that have become centers for laundering and sheltering money must be made to desist. The United States has the power: We could refuse to allow pirate financiers to move currency through the U. S. , or impose customs limitations on their trade and search all their cargoes, or forbid Americans to do business there.
* Controls on electronic money. We must insist that the electronic movement of capital be regulated far more strictly. The technology is available to monitor all electronic money transfers. But bankers, although they pretend otherwise, aren't doing all they can to identify the sources of money crossing their threshold. We need to make sure they understand their obligations as key players in enforcement efforts.
* Global asset forfeiture laws. The personal holdings of criminals are often located in any number of foreign lands -- yachts in the Caribbean, homes in the south of France. Each country should have laws allowing domestic and foreign law enforcement to seize and share the property of convicted criminals.
* Transnational courts. In partnership with friendly nations, we need to experiment with a system of special courts to try at home cases involving victims abroad. In such cases, which would be accepted only by agreement between both nations, trials could take place wherever the evidence and witnesses were located, applying the laws of the country where the crime took place.
* More U. S. law enforcement officers abroad. As FBI director Louis J. Freeh wrote recently, "If the FBI operates only in the United States, there is no way we can cope with crime threats of foreign origin that suddenly arrive full-blown in the United States. " We should add 1,000 officers to the 2,000 already stationed abroad. Every U. S. embassy should have a law enforcement team.
The damage done by international crime is rarely as specific and dramatic as that of a terrorist attack, but in fact it is greater. We cannot see the billions of dollars hemorrhaging out of our economy. We cannot directly feel the violation of our sovereignty and territorial integrity by the smugglers of narcotics and human beings. We cannot easily envision the harm to our national security through the failure of countries that once bravely struggled for the dignity of freedom.
If, however, we prove unable to connect the drive-by shooting with the jungle laboratory and the numbered account, we will fail to understand the world we live in. Worse, we will fail to meet our challenge at a critical junction in human history.
Sen. John Kerry (D-Mass. ) chaired the Senate Subcommittee on Terrorism, Narcotics and International Operations. This article is adapted from his book, "The New War," to be published next month by Simon & Schuster.
Washington Post Online © 1997 Washington Post. All rights reserved.
DIALOG® File Number 146 Accession Number 4124940
On that somber note, we would like to conclude our analysis.